Government mail service may be affected by the Canada Post labour disruption. Learn about how critical government mail will be handled.
Introduction
Price differences, or spreads, in wheat grades and protein levels result from the open market response to supply and demand fundamentals. Buyer specifications for wheat characteristics required for end-product production drive the market.
Wheat is classified not only by grade but also by desirable milling characteristics such as protein content within each individual grade. Canola, on the other hand, has a comparatively simple grading system: #1 or #2, #3, or sample, usually with no other quality factors.
Watch the video Wheat Quality: Why it Matters
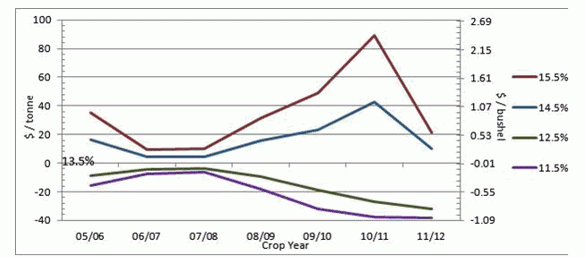
Historically, the price premiums or discounts across the protein spread have moved around significantly from year to year. For example, Canadian Wheat Board payments for the 2006- 07 crop year, a year of abundant high-grade, high-protein milling wheat production in Canada, provided a premium of $4.56 per tonne, $0.12 per bushel, for #1 Canada Western Red Spring (CWRS) 14.5% protein over #1 CWRS 13.5% protein.
At the other extreme, the 2010-11 crop year produced well below average quality and protein content due to excessive moisture and cool conditions in many prairie regions. The resulting payment spread for #1 CWRS 14.5% protein over 13.5% protein was $42.82 per tonne or $1.17 per bushel.
Figure 1. Historical Canadian Wheat Board payment spreads for 1 CWRS 13.5% protein.

This example highlights an important market supply principle underlying protein price spreads. If there is abundant production of high-quality, high-protein wheat, then there is a large supply of protein in the market and premiums will be relatively low. If the overall protein content of the wheat crop is low, then the price premiums for wheat with high protein content will be larger as buyers compete to fill their specific quality needs from a smaller supply.
The open market
Open market wheat pricing resulted in more variation in the price spreads across wheat grades and protein levels. Prior to the open market wheat system, farmers would not have seen the impact of a change in world wheat stocks, or a high yielding but low protein domestic crop until they received final payments.
The open market signals to producers the market supply and demand conditions through buyers' price bids. Prices change not only between crop years and over the months within a year, but may fluctuate on a daily basis.
While protein is a standard industry measure, the demand for high protein is specific to buyer specification within individual markets. Grain handlers incur costs to segregate grain by quality at their facilities and each handler may not maintain the same or the same number of protein spread segregations.
What you can do
Take the time to learn about protein spreads, the relative profitability of wheat classes, and other market factors. Consider the wheat price spreads and what they mean for your farm. Take the time to understand what the market information means, and how it impacts your decisions.
Know the quality of your harvested crop. It is difficult to market a crop without understanding what you have in the bin, and the price implications of quality characteristics. Proper sampling at harvest time and getting your crop graded by an independent grader, such as the Canadian Grain Commission, has become more important.
Shop around for the buyer offering you the best net price for your specific wheat grades and protein levels.