Introduction
The United States is a market leader in many of the world's major crops. Understanding where and when major United States crops are grown can help Canadian farmers market their crops. Reports on United States seeded acreage, growing conditions, weather forecasts, production reports, and harvest progress are all relevant for Canadian farmers.
Some reports, particularly in farm papers, are interesting news, but they have little market significance. Other reports are very important. Knowing where the various crops are grown can help separate important market news from market noise.
Corn, soybeans, barley and oats
The largest United States crop in terms of total production is corn, the majority of which is grown in a region known as the Corn Belt. The second largest crop grown in the United States is soybeans. As with corn, soybeans are primarily grown in the Midwestern states.
The United States barley crop is of most interest to Canadian malt barley growers. United States barley is grown over a wide geographic area with about 60% as much barley production as Canada.
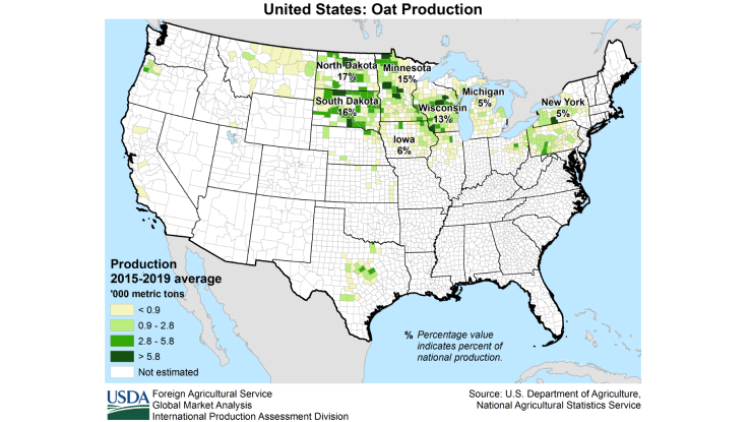
Although the United States produces some oats, Canada is the world's largest oat exporter and supplies about 70% of the oats imported into the United States.
Table 1 and Figures 1 to 4 show the average annual production of these crops in the United States, where they are grown, when they are seeded, when the crop flowers or heads, and when it is harvested.
Table 1. Crop production in the United States
| Crop | Average annual production 2015 to 2019 | Primary growing areas | Seeding | Flowering or heading | Harvesting |
| Corn | 14 billion bushels | Iowa Illinois Nebraska Minnesota Indiana Kansas | April and May | July through first half of August | October and November |
| Soybeans | 4 billion bushels | Illinois Iowa Minnesota Nebraska Indiana | May and June | July through first 3 weeks of August | Late September through October |
| Barley | 160 million bushels | Idaho North Dakota Montana Colorado Wyoming Washington | April and May | July through first half of August | Late July to end of September |
| Oats | 53 million bushels | North Dakota South Dakota Wisconsin Minnesota Iowa | April and May | July through first half of August | August and September |
Source: USDA Crop Production 2019 Summary
US crop production maps
Find out more at USDA Foreign Agriculture Services
Figure 1. United States corn production
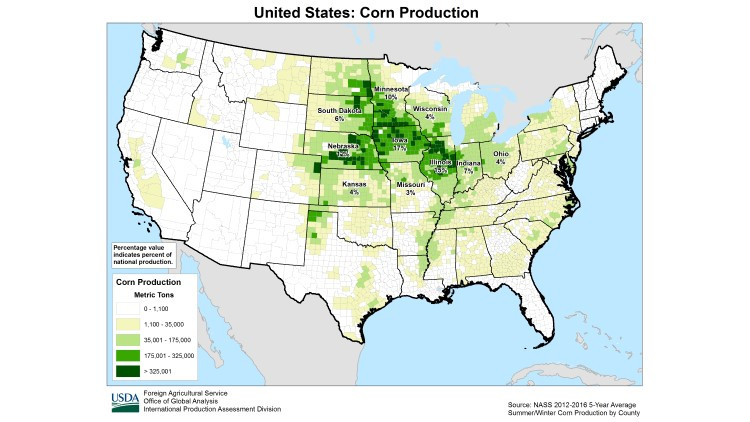
Figure 2. United States soybean production
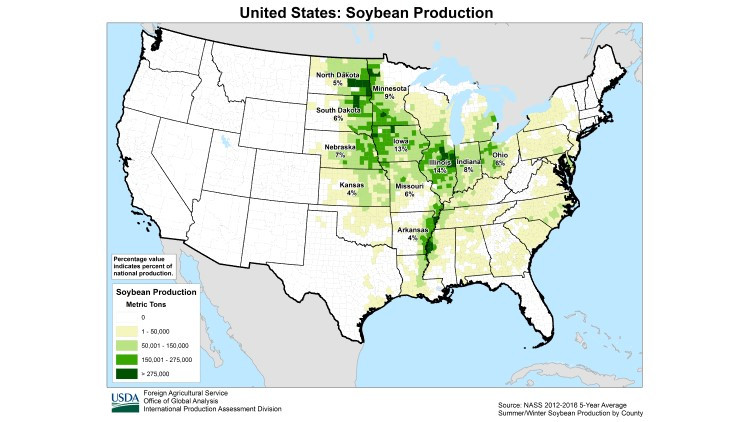
Figure 3. United States barley production
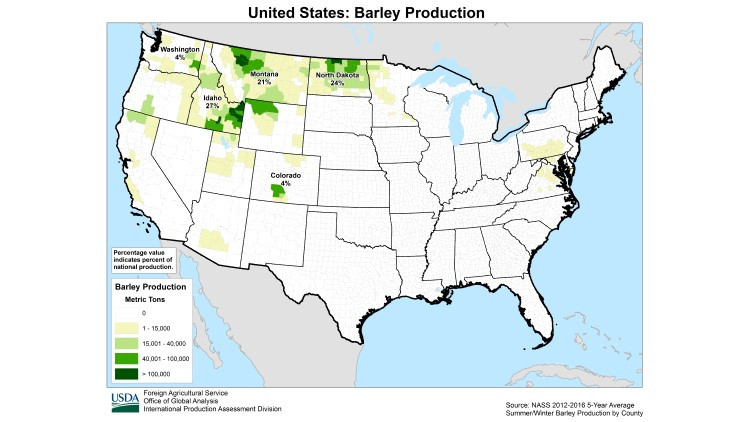
Figure 4. United States oat production
Wheat
The third largest crop grown in the United States is wheat. The United States produces hard red, soft red and white winter wheats and hard red and durum spring-seeded varieties. A very small amount of white spring wheat is also grown.
Table 2 and Figure 5 show the primary growing areas for each type of wheat, including the average seeding, heading, and harvesting dates.
Table 2. Wheat production in the United States
| Type of wheat | Average annual production 2017 to 2019 | Primary growing areas | Seeding | Heading | Harvesting |
| Hard red winter wheat | 748 million bushels | Kansas Colorado Oklahoma Texas | Late August to end of October | The following year from late April through early June | Late May through August |
| Hard red spring wheat | 498 million bushels | North Dakota South Dakota Montana | April to May | Mid-June to mid-July | Late July through mid-September |
| Soft red winter wheat | 273 million bushels | Indiana Ohio Illinois North Carolina Arkansas Tennessee | Late September to end of October | The following year from late April through early June | June through July |
| Soft white winter wheat | 252 million bushels | Washington Oregon Idaho | Early September to mid-November | The following year from mid-May to end of June | July through August |
| Durum wheat | 62 million bushels | Wisconsin North Dakota Montana South Dakota | April to May | Mid-June to mid-July | Mid-July through mid-September |
| Hard white winter wheat | 16 million bushels | Kansas
| Late August to end of October | The following year from late April through early June | July through August |
Figure 5. Wheat Production Areas in the United States
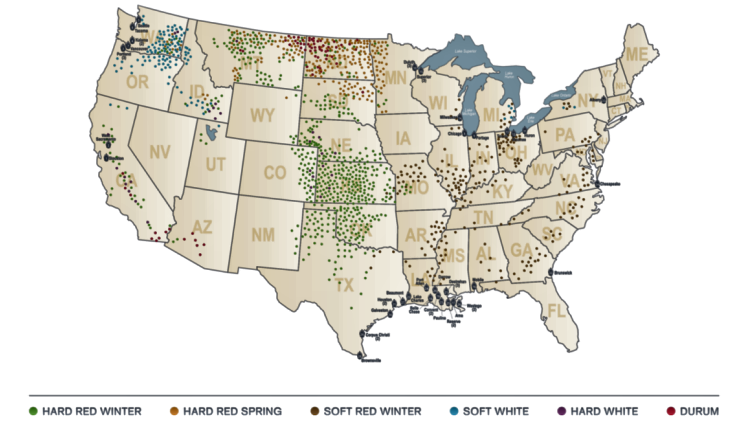
Source: National Association of Wheat Growers 2013, 2017 map of wheat grown by region.
Market noise
The goal of this article is to help farmers to decide what is market noise and what is market news. For example, if you hear a report that says that the corn crop in Utah is suffering from drought, you will know that is market noise rather than significant market news as Utah does not produce a great deal of corn. Similarly, if you hear that the soybean crop in Georgia has been damaged by a frost, you will know that is market noise.
Exporting to the United States
If you are interested in exporting to the United States, watch the video: Exporting Grain, Oilseeds and Special Crops to the United States.