About the indicator
When wildfires burn trees and other plant material they emit smoke, which is a complex mixture of gases and particles. The smoke is then transported over short and long distances, including across provincial and federal borders. Wildfire smoke can often impact large areas hundreds of square kilometres in size for extended periods of time (days or weeks).
Wildfire smoke is a major contributor to poor air quality and can have far-reaching impacts on both the environment and human health. The smoke generated by a wildfire contains a mixture of pollutants, including particulate matter, carbon monoxide, nitrogen oxides, and volatile organic compounds (VOCs), which can be harmful when inhaled.
This indicator provides information on wildfire prevalence (estimated area burned between 1990 and 2024) and wildfire smoke impacts on air quality (the number of days a long-term air quality monitoring station is impacted by wildfire smoke between 2015 and 2024).
Wildfire smoke facts
Wildfire season varies across different jurisdictions. In Alberta, the official wildfire season is set provincially and runs from March 1 to October 31.
Wildfire pollutants and human health
One of the primary health impacts of wildfire smoke is its effect on respiratory health. Fine particulate matter, (PM2.5, particles less than 2.5 micrometers (µm) in diameter) within smoke can penetrate deep into the lungs and cause irritation, making it difficult to breathe. This makes those with pre-existing medical conditions, especially underlying heart and/or lung problems, particularly vulnerable.
Other pollutants that are in, or created by, wildfire smoke include (among others):
- nitrogen dioxide (NO2)
- ozone (O3)
- sulphur dioxide (SO2)
- polycyclic aromatic hydrocarbons (PAHs)
The type and concentration of pollutants in wildfire smoke depend on many factors including:
- distance that smoke has travelled
- type of vegetation burned
- age of the smoke
Wildfire smoke can reduce visibility, irritate the eyes, cause strong odour, and can have significant impacts on outdoor activities. Smoke can also affect indoor air quality.
Causes of wildfire
Wildfires can be caused by both natural events (for example lightning) and human activity (for example campfires, cigarettes, fireworks, off-highway vehicles, incendiary, devices or industrial activity).
Wildfire size and areas burned
Recorded wildfires vary dramatically in size with some being less than 0.1 hectares to some being over 100,000 hectares (which is approximately the size of Calgary or Edmonton).
Area burned by wildfires has increased in North America most likely due to increasing global temperatures and increased human activity (Intergovernmental Panel on Climate Change (IPCC), 2022). This can result in more frequent poor air quality events due to wildfire smoke.
The annual extent of burned area is influenced by the presence of long-term drought, high winds, timing and location of precipitation and extreme weather events, among other factors.
Wildfire smoke experienced by Albertans most often originates from fires burning in Alberta, British Columbia (B.C.), and the northwestern United States (U.S.) due to predominant wind directions.
For more information on wildfire smoke and air quality in Alberta, see the wildfire smoke information page.
Methods
For information on how the results in this indicator were calculated and for references, see: Condition of the Environment Report – Air Component
Results
Last updated: February 2026
Summary of key results
- The total estimated area burned by wildfires in Alberta has increased in recent decades (1995-2004: 2,630,736 ha; 2005-2014: 2,660,820 ha; 2015-2024: 6,753,759 ha) and wildfires have become more prevalent in spring months.
- Effects of wildfires and wildfire smoke differ across regions depending on location and extent of wildfires.
- In 2024, Alberta’s central and northeastern regions observed more wildfire smoke impacts than southern and western regions.
Variation across Alberta
In 2024, wildfire smoke affected Alberta at several points through the summer:
- Fires in northeastern and southeastern B.C. led to smoke across much of the province in mid-May with relatively few impacts occurring in June.
- In mid-July, wildfires in northeastern and southeastern B.C., northern Alberta, northern Saskatchewan, and the southern Northwest Territories contributed to widespread smoke, with northern and southern sources affecting their respective regions of Alberta.
- Wildfires in the southern Northwest Territories, northern Alberta, central Saskatchewan, and central Manitoba impacted much of the province again in mid-August.
- In September, fires in central B.C. influenced air quality in central and northern Alberta.
Wildfire smoke impacts on air quality vary across the province depending on the location and extent of wildfires. One of the major components of smoke posing a risk to human health is PM2.5. Figure 1 shows the number of days affected by wildfire smoke with elevated PM2.5 concentrations (daily average PM2.5 > 15 µg/m3) for select monitoring stations in 2024.
- Stations in northern Alberta were affected more frequently by wildfire smoke than those in southern Alberta in 2024.
- The Fort McMurray-Athabasca Valley station was affected more frequently by wildfire smoke in 2024 (total of 61 days) than any other station in this analysis due to wildfires in northern B.C., northern Alberta, northern Saskatchewan, central Manitoba, and the southern Northwest Territories.
The areas of the province most impacted by wildfire smoke differ from year to year.
- In 2021, wildfire smoke from fires burning in B.C. and the northwestern U.S. throughout the months of July and August, as well as smoke from wildfires in Saskatchewan in early October, affected much of the province.
- In 2022, wildfire smoke from fires burning in northern Alberta throughout the month of July primarily affected stations in northern Alberta. Much of the province was affected by smoke throughout August due to wildfires in B.C., the Northwest Territories and northern Alberta, and from September to early October due to wildfires in B.C. and the northwestern U.S.
- In 2023, wildfire smoke from fires burning in northern B.C. and Alberta impacted air quality throughout Alberta in May and June, while wildfires burning in northern Alberta, B.C. and the southern Northwest Territories affected air quality, primarily in central and Northern Alberta, from July to September.
Figure 1. Number of days that select stations were impacted by wildfire smoke in Alberta in 2024. Circles represent current long-term continuous air quality monitoring stations.
Select a circle on the map to view the number of days that were impacted by wildfire smoke for a specific monitoring station.
Source: Government of Alberta
Changes over time
Wildfire prevalence
Figure 2 shows the total estimated area burned (in hectares) for western Canadian provinces and territories as well as western U.S. states. Due to the random occurrence of megafires (greater than 40,500 ha) that can occur for a variety of reasons, it is difficult to identify trends in the data. However, in Alberta, there is a statistically significant increase in the area burned annually by wildfires since 1990.
The area burned in Alberta and neighbouring Canadian provinces and territories that impact Alberta, is often greater than the area burned across western U.S. states (Figure 2). This could be due to several factors, such as differences in region total area, population, and fire prevention practices, among others.
- 2020 is notable for a small total area burned across Alberta and neighbouring Canadian provinces, and can be attributed to substantial precipitation, among other factors (Canadian Interagency Forest Fire Centre, 2020). However, 2020 was a very active fire season in the western U.S. with area burned in California being the highest in that state over the past 20 years.
- In 2023, wildfires burned more area in Alberta than in any previously recorded year. Similarly, in 2023, Saskatchewan, B.C., and the Northwest Territories saw some of the largest area burned in recent decades.
- In 2024, Northwest Territories saw the highest area burned compared to other states, provinces or territories in the West.
For more information on wildfires in Alberta see the Alberta Wildfire page.
Figure 2. Stacked bar graph showing the total area burned (in hectares) by year from 1990 to 2024.
U.S. data from the National Interagency Fire Center is only available from 2002 onward.
Canadian Source: National Forestry Database and U.S Source: National Interagency Fire Center
Wildfire smoke impacts
The number of wildfire smoke impacted days (daily average PM2.5 > 15 µg/m3) each year is highly variable across monitoring stations and depends on several factors, including fire location and meteorology, among others (Figure 3).
- For example, in 2016, the Fort McMurray air quality monitoring station was significantly impacted by the Horse River Wildfire (see Focused study section below).
- In 2023, wildfire smoke impacted some northern Alberta stations for more than 100 days of the year, whereas southern Alberta stations were impacted for as few as 26 days, approximately one quarter of impacted days in northern Alberta.
- In 2024, central and northern Alberta saw more wildfire smoke impacted days (particularly Fort McMurray and Edmonton) compared with southern Alberta.
Figure 3. Number of days that select large urban centre monitoring stations across Alberta were affected by wildfire smoke from 2015 to 2024.
Source: Government of Alberta
Seasonal variation
Wildfire prevalence
The timeline for wildfire activity varies across different regions (Figure 4), but wildfires generally begin in late spring and taper off in early fall. In Alberta, wildfire activity peaks in May and tends to decline in area burned through June, which is typically the province’s wettest month. Whereas in B.C., wildfire activity peaks in July and August when conditions are hottest and driest.
In the last ten years, Alberta fires have burned more hectares in May and June than in previous 10-year periods. B.C. fires have remained most prevalent in July, albeit with area burned increasing over the past three 10-year periods, possibly due to climate change and increased human activity.
Figure 4. Seasonal variation in monthly area burned (in hectares) over 10-year periods from 1995 to 2024.
Due to 2023 being an extreme year for wildfire prevalence, the most recent decade may be biased toward 2023 results.
Source: National Forestry Database
Wildfire smoke impacts
Figure 5 shows the average number of days per year that Alberta’s large urban centres were affected by wildfire smoke (daily average PM2.5 >15µg/m3) by month during the 2015 to 2024 period.
- Northern areas, including Fort McMurray and Grande Prairie, experience the most wildfire smoke days earlier in the wildfire season (i.e., May) compared with other stations over this 10-year period.
- Central and southern areas, including Edmonton, Red Deer, Calgary, Lethbridge and Medicine Hat, experience the most wildfire smoke days later in the wildfire season (i.e., August) over this 10-year period.
Figure 5. Seasonal variation in monthly average number of days impacted by wildfire smoke at large urban centre monitoring stations in Alberta from 2015 to 2024.
Source: Government of Alberta
Limitations of the dataset
- Only days with daily average PM2.5 concentration greater than 15 µg/m3 were included in the identified wildfire smoke impacted days.
- There may be additional days with lower PM2.5 concentrations that were impacted by wildfire smoke but not included in the results.
- For data showing average number of impacted days per year, only large urban centre stations were included due to limited data in rural regions.
- Long-term air quality monitoring stations do not cover all regions of Alberta, therefore monitoring gaps may incorrectly suggest that wildfire smoke impacts do not occur in those areas.
- Different jurisdictions might vary in their reporting of area burned due to differences in land use, among others.
- For example, Alberta reports area burned within the province’s Forest Protection Area, while Saskatchewan reports area burned data under the Intensive Protection Zone.
- U.S. data from the National Interagency Fire Center is only available from 2002 onward. U.S. data beyond 2018 does not include prescribed burns (which are not expected to be significant in size).
Focused study
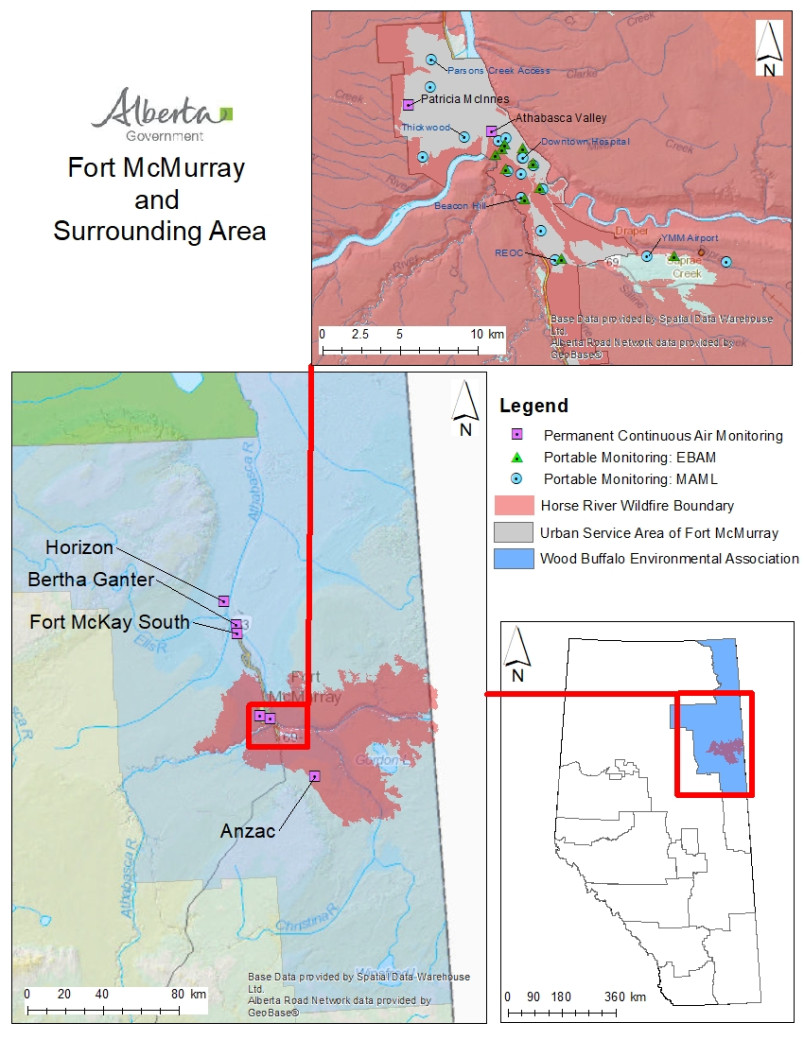
The Alberta government deploys air quality monitoring to support emergency response during wildfires. During the 2016 Horse River wildfire in Fort McMurray, air monitoring was deployed to support decisions to protect the health of emergency response personnel and the public. The extent of the wildfire is shown in Figure 6. The report, Characterization of air quality during the 2016 Horse River wildfire, summarizes air quality data collected during the fire.
Key findings include:
- Very high concentrations of PM2.5 that exceeded health-based objectives were observed from both permanent and portable air quality monitoring equipment due to wildfire smoke.
- Median hourly ammonia (NH3) concentrations were 3 times and 22 times higher during the wildfire than during the non-wildfire impacted period at the Fort McKay-Bertha Ganter monitoring station and Fort McMurray-Patricia McInnes monitoring station, respectively.
- 13 episodes of hourly carbon monoxide (CO) concentrations exceeding the health-based Alberta Ambient Air Quality Objective (AAAQO) of 13 ppm were recorded at the Fort McMurray-Athabasca Valley station, and the median hourly concentrations were 2 times higher than the non-wildfire impacted period.
This demonstrates that measurements of additional parameters beyond PM2.5 provide valuable information about the composition of the smoke plume and risk to human health.
Figure 6. Fort McMurray and surrounding area with air quality monitoring stations and Horse River Wildfire boundary indicated. Portable Environmental Beta Attenuation Monitors (EBAMs) and the Government of Alberta’s Mobile Air Monitoring Laboratory (MAML) were deployed to the area to track pollutant concentrations.
Resources
Ambient Air Quality Objectives (AAAQOs)
Canadian Ambient Air Quality Standards (CAAQS)