About the indicator
Nitrogen dioxide, or NO2, is an air pollutant that can negatively affect human health and the environment. Exposure to NO2 can lead to increased risk of respiratory problems. NO2 also adversely affects ecosystems when it is deposited onto the ground, for example, through acidic deposition, commonly known as acid rain.
This indicator reports on the concentration of NO2 from 2000 to 2024 and provides information on the variation across Alberta and how concentrations have changed over time. This indicator also compares NO2 concentrations with Alberta’s Ambient Air Quality Objectives (AAAQOs), which set thresholds for air pollutants to protect human and ecosystem health.
Nitrogen dioxide facts
- Nitric oxide (NO) and NO2, collectively referred to as NOx, are gases produced during high-temperature combustion in air. Most NOx is emitted into the atmosphere as NO but is quickly converted to NO2.
- Major sources of NO2 are the emissions caused by the burning of fossil fuels used in vehicles, home heating and industrial processes. NO2 also occurs naturally in the environment due to forest fires, lightning or emissions from the soil.
- NO2 contributes to the development of other air pollutants, such as ozone, nitric acid and particulate matter. Near large cities, it contributes to smog which is visible as the brownish haze in the lower atmosphere.
- NO2 is part of the Air Quality Health Index (AQHI) that reports on health risks associated with local air quality across Alberta in real-time.
Methods
For information on how the results in this indicator were calculated and for references, see: Condition of the Environment Report – Air Component
Summary of key results
Last updated: February 2026
- NO2 concentrations have been decreasing throughout much of the province over the past 2 decades due to improved emissions control technology at sources, including personal vehicles and industry.
- Since 2005, NO2 concentrations have consistently been below the annual AAAQO across the province. Historically, exceedances of the one-hour AAAQO have occurred infrequently.
- NO2 concentrations are higher in urban areas, with Alberta’s highest concentrations in Calgary and Edmonton.
Variation across Alberta
- Alberta’s cities see higher concentrations of NO2 when compared to smaller communities, with Calgary and Edmonton showing the highest concentrations of NO2 in the province (Figures 1a and 1b).
- Higher NO2 concentrations in cities occur due to a higher number of emission sources including vehicles. Industrial sources that emit NO2 are also often located in or near urban areas.
- NO2 concentrations are also elevated near major industrial sources, such as in the mineable oil sands region and the industrial heartland northeast of Edmonton.
Figure 1a.
Annual average NO2 concentrations across Alberta for 2024Select a circle on the map to view the 2024 concentration and the 10-year trend in monthly average concentrations for a specific monitoring station.
Source: Government of Alberta
Figure 1b.
Peak NO2 concentrations across Alberta for 2024Select a circle on the map to view the 2024 concentration and the 10-year trend in monthly average concentrations for a specific monitoring station. Peak concentrations are calculated as the annual 98th percentile of daily maximum concentrations.
Source: Government of Alberta
Changes over time
Between 2000 and 2024, Alberta saw a statistically significant decrease in annual average and peak concentrations of NO2 when averaged across all monitoring stations (Figure 2). This general trend is consistent with trends across Canada as improved technologies have reduced NO2 concentrations from various emissions sources.
- Most major population centres, including Edmonton and Calgary, saw a statistically significant decrease in NO2 annual average and peak concentrations between 2000 and 2024.
- Grande Prairie and Fort McMurray saw steady annual average and peak concentrations over this period, potentially due to increased industrial operations and population growth that may have offset improved emissions technologies in these regions.
- Peak concentrations in Medicine Hat also remained steady over this period.
Examining the trends over more recent years and for all stations across the province provides additional information on the changes over time for the indicator. Between 2015 and 2024, there was a statistically significant increasing trend in monthly average NO2 concentrations at some monitoring stations:
- Anzac, Fort McKay South and Fort McKay-Bertha Ganter in northeastern Alberta
- Tamarack and St. Lina near Cold Lake
- Beaverlodge near Grande Prairie
- Range Road 220 located northeast of Edmonton
However, NO2 concentrations at these stations remained low compared to stations located in larger cities. For more information on spatial variability in NO2 concentrations, see Figure 1.
Figure 2. Trends in NO2 concentrations from 2000 to 2024 at large population centres in Alberta
Select a community in the legend to toggle it on or off in the chart.
The 10th percentile is the value below which 10% of the data may be found. The 90th percentile is the value below which 90% of the data may be found. The horizontal dashed line represents the Alberta Ambient Air Quality Objective (AAAQO) for annual average NO2.
Peak concentrations are calculated as the annual 98th percentile of daily maximum concentrations.
Source: Government of Alberta
Comparison to provincial objectives
- Alberta's Ambient Air Quality Objectives provide thresholds for over 30 airborne compounds to protect human and ecosystem health. The AAAQOs are used in the design of industrial facilities and to establish emissions requirements. The Alberta government tracks AAAQO exceedances and assesses the need for management action.
- Since 2005, NO2 concentrations have consistently been below the annual AAAQO for all stations across the province (Figure 2). The annual objective for NO2 is 24 parts per billion (ppb) based on the protection of ecosystems.
- In 2024, there were no exceedances of the one-hour AAAQO for NO2. Historically, exceedances of the one-hour AAAQO for NO2 have occurred infrequently – 0 to 3 times per year – in various locations across Alberta. The one-hour AAAQO for NO2 is 159 ppb based on the protection of human health.
Air quality reporting and resources
- Alberta reports annually on the status of air quality for existing regional air quality management frameworks (AQMFs) as well as the Canadian Ambient Air Quality Standards (CAAQS).
- NO2 is one of the pollutants reported on through the South Saskatchewan Region (SSR) AQMF and Lower Athabasca Region (LAR) AQMF as well as the CAAQS.
- The most recent assessment results are available in Alberta’s Air Zone Reports.
- Published reports and scientific papers on air quality in Alberta are available via the Air Indicators landing page under ‘Related Publications’.
- Alberta also provides air quality data and information to the public through the near real-time AQHI website and provides access to quality assured data via Alberta’s Air Data Warehouse.
Focused study
Meteorology influences the dispersion, transformation, and deposition of pollutants in the environment. Meteorological conditions such as surface-based temperature inversions, where the temperature increases with height, create a stable lower atmosphere that can trap pollutants near the ground.
A recent study by the Government of Alberta (Brown et al., 2025) investigated the impact of surface-based temperature inversions on NO2 concentrations at Alberta community monitoring stations from 2015 to 2019. A better understanding of how temperature inversions relate to pollutant concentrations provides a more complete picture of the processes affecting air quality in Alberta.
Key findings include:
- Elevated (≥ 32 ppb) daily maximum NO2 concentrations were more likely during the morning commuter period and in the evenings under cool, stable atmospheric conditions (Figure 3). This illustrates the influence both local emissions and meteorology have on elevated NO2 concentrations.
- Elevated daily maximum NO2 concentrations were most frequently observed in the winter months (Figure 3) when atmospheric inversions are more frequent and long lasting.
- The presence of inversions tended to increase NO2 concentrations during times when emissions would have caused only moderate levels in their absence.
- While inversions may not always directly cause elevated NO2 concentrations, they may contribute to the frequency of observed elevated concentrations.
Figure 3.
Frequency of elevated daily maximum NO2 concentration (≥ 32 ppb) by time of the day and season.
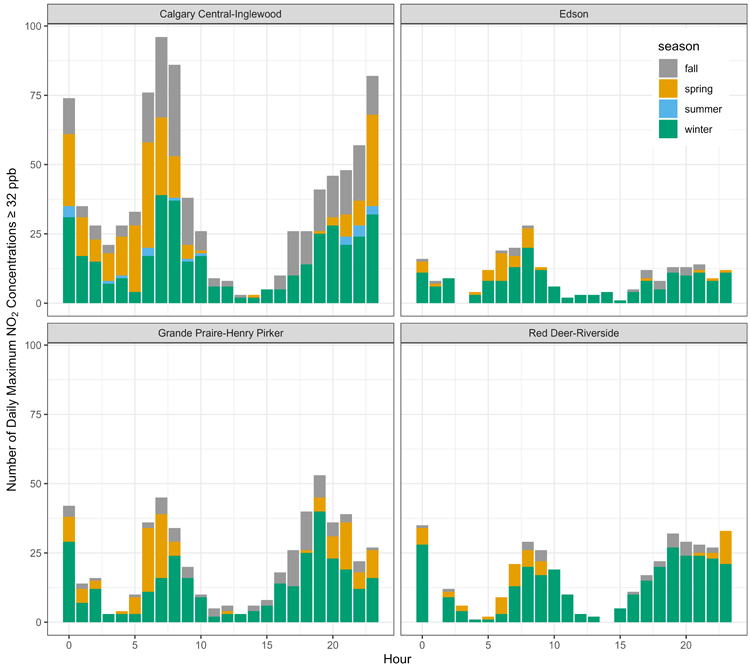
Source: Government of Alberta