Government mail service may be affected by the Canada Post labour disruption. Learn about how critical government mail will be handled.
About the indicator
Ground-level ozone, or O3, is an air pollutant that can negatively affect human health and the environment. O3 is not emitted directly into the atmosphere by humans, but forms through chemical reactions with precursor gases in the presence of heat and sunlight. Precursor gases, such as nitrogen dioxide (NO2) and volatile organic compounds (VOCs), are emitted by human activities in urban and industrial centres and by natural sources such as wildfires. Vegetation is another major source of natural VOCs.
This indicator reports on the concentration of O3 from 2000 to 2023 and provides information on the variation across Alberta and how concentrations have changed over time. This indicator also compares O3 concentrations with Alberta's Ambient Air Quality Objectives (AAAQOs), which set thresholds for air pollutants to protect human and ecosystem health.
Ozone facts
- O3 is found both in the lower and upper atmosphere of the Earth. In the lower atmosphere and at ground-level, exposure to O3 is harmful to humans as it irritates the respiratory system. In the upper atmosphere, O3 occurs naturally and protects the Earth from the sun’s harmful ultraviolet radiation.
- Higher levels of O3 can be transported to the ground from the ozone-rich upper atmosphere under certain weather conditions.
- O3 is a major component of smog which is a mixture of gases and particles emitted into the air by human activities. Smog negatively affects human health and forms haze which reduces visibility.
- O3 is part of the Air Quality Health Index (AQHI) that reports on health risks associated with local air quality across Alberta in real-time.
Methods
For information on how the results in this indicator were calculated and for references, see: Condition of the Environment Report – Air Component
Summary of key results
Last updated: February 2025
- Over the past 2 decades, O3 peak concentrations have remained steady, however annual average O3 levels have increased in some population centres.
- Elevated O3 concentrations in Alberta can occur during summertime smog episodes, wildfire smoke episodes, and due to natural atmospheric fluctuations in the spring (driven by several factors, such as seasonal patterns in meteorology and long-range transport of ozone precursor gases).
Variation across Alberta
- Annual average and peak O3 concentrations vary across the province (Figure 1).
- Elevated O3 concentrations can be observed near major population centres due to summer smog episodes and in areas of the province affected by wildfire smoke.
- Elevated O3 concentrations are common in regions such as the foothills that are at higher elevations and have increased forest cover (which results in higher natural VOC emissions).
- Many factors influence the variation in O3 concentration across Alberta, including meteorological conditions that influence O3 formation and transport (for example, solar radiation and wind speed), concentration of O3 precursors (VOCs, NO2), among others.
Figure 1a. Annual average O3 concentrations across Alberta for 2023
Select a circle on the map to view the 2023 concentration and the 10-year trend in monthly average concentrations for a specific monitoring station.
Source: Government of Alberta
Figure 1b. Peak O3 concentrations across Alberta for 2023
Select a circle on the map to view the 2023 concentration and the 10-year trend in monthly average concentrations for a specific monitoring station. Peak concentrations are calculated as the annual 4th highest daily maximum of rolling 8-hour concentrations.
Source: Government of Alberta
Changes over time
- From 2000 to 2023, no significant trend over time was observed for annual average or peak concentrations of O3 averaged across all long-term air monitoring stations in Alberta (Figures 2a and 2b, respectively).
- Four major population centres (Calgary, Edmonton, Fort McMurray, and Medicine Hat) saw statistically significant increasing trends in annual average O3 concentrations between 2000 and 2023. No major population centre observed statistically significant trends in peak O3 concentrations over this period.
- Variability between years is driven by varying background levels of O3 that occur naturally, as well as the extent of summer smog episodes and wildfire smoke events.
- In 2016, high peak O3 concentrations in Fort McMurray were caused by smoke from the Horse River wildfire that entered the community and had major impacts on air quality (Figure 2b).
Figure 2a. Trends in annual average O3 concentrations from 2000 to 2023 at large population centres
Chart data table
| Year | Provincial Average | 10th Percentile | 90th Percentile | Calgary | Edmonton | Fort McMurray | Grande Prairie | Lethbridge | Medicine Hat | Red Deer |
|---|---|---|---|---|---|---|---|---|---|---|
| 2000 | 32.7 | 24.9 | 42.1 | 27.5 | 27.2 | 27.6 | 31.4 | |||
| 2001 | 34.6 | 26.6 | 42.7 | 29.8 | 28.5 | 27.9 | 32.4 | |||
| 2002 | 34.1 | 26.5 | 42.4 | 29.7 | 29.4 | 28.5 | 32.9 | |||
| 2003 | 35.3 | 28.3 | 42.7 | 30.1 | 30.5 | 29.4 | 34 | |||
| 2004 | 33.8 | 28.7 | 38.7 | 28.6 | 28.7 | 29.3 | 33.1 | 39.3 | 37 | 31.2 |
| 2005 | 32.3 | 27.2 | 37.8 | 27.9 | 28 | 27.6 | 28.9 | 38.5 | 35.2 | 32.5 |
| 2006 | 34 | 28.6 | 39.8 | 29.6 | 30 | 30.6 | 28.2 | 39.2 | 37.5 | 33.5 |
| 2007 | 33.2 | 27.7 | 38.8 | 29.9 | 29.9 | 27.6 | 30.4 | 39.1 | 38 | 33.2 |
| 2008 | 33.7 | 26.9 | 39 | 31.6 | 30.8 | 26.8 | 31.9 | 38.7 | 35.2 | 33 |
| 2009 | 35.5 | 28.9 | 41.2 | 33.8 | 31.6 | 28.8 | 31.9 | 40.3 | 38.9 | 34.2 |
| 2010 | 33.5 | 28.7 | 37.8 | 29.8 | 28.2 | 31.1 | 29.4 | 36.9 | 36.3 | 29.7 |
| 2011 | 36.3 | 31.2 | 40.6 | 33.5 | 33.4 | 30.6 | 33.1 | 40.4 | 38.4 | 32.2 |
| 2012 | 34.1 | 27.8 | 39.3 | 31 | 30.8 | 30.8 | 31.8 | 40.3 | 39.3 | 31 |
| 2013 | 35 | 28.7 | 39.4 | 34.4 | 32.1 | 29.2 | 32.7 | 39.5 | 38.1 | 31.4 |
| 2014 | 33.8 | 28.6 | 38 | 32.6 | 30.7 | 29.4 | 30.1 | 38.7 | 37.2 | 28.8 |
| 2015 | 34.2 | 30.4 | 38 | 34.6 | 29.9 | 30.4 | 32.2 | 40.2 | 37.3 | 33.2 |
| 2016 | 32.3 | 28.9 | 35.4 | 31.6 | 29.6 | 32.8 | 29 | 37.5 | 36.2 | 30.1 |
| 2017 | 35.8 | 31.7 | 41.1 | 36.8 | 31.4 | 36.2 | 33 | 40.4 | 41.1 | 34.2 |
| 2018 | 35.8 | 31.3 | 40.1 | 34.9 | 33.7 | 34.8 | 31 | 40.9 | 40.4 | 37 |
| 2019 | 34.5 | 31.2 | 37.3 | 35.1 | 31.5 | 33.2 | 30.8 | 37.5 | 39.5 | 34 |
| 2020 | 33.9 | 30.6 | 37.3 | 34.5 | 30.8 | 31.4 | 31.2 | 38.4 | 38.8 | 33.9 |
| 2021 | 36.1 | 33.4 | 39.9 | 37.7 | 34.3 | 32.7 | 33.1 | 41 | 41.8 | 36.3 |
| 2022 | 35.6 | 32 | 39.3 | 37.8 | 34.1 | 31 | 33.9 | 39.1 | 39.5 | 36.2 |
| 2023 | 37.6 | 34.3 | 41.3 | 39.4 | 35.2 | 34.5 | 34.5 | 41 | 41 | 38.7 |
Select a community in the legend to toggle it on or off in the chart. The 10th percentile is the value below which 10% of the data may be found. The 90th percentile is the value below which 90% of the data may be found.
Source: Government of Alberta
Source: Government of Alberta
Chart description
Line chart showing the change over time in annual average O3 concentrations for large urban centres in Alberta, the provincial average, and the 10th and 90th percentile of all O3 monitoring stations in the province.
Figure 2b. Trends in annual peak O3 concentrations from 2000 to 2023 at large population centres
Chart data table
| Year | Provincial Average | 10th Percentile | 90th Percentile | Calgary | Edmonton | Fort McMurray | Grande Prairie | Lethbridge | Medicine Hat | Red Deer |
|---|---|---|---|---|---|---|---|---|---|---|
| 2000 | 58.1 | 46.8 | 66.2 | 54.2 | 57.3 | 48.5 | 59.4 | |||
| 2001 | 58.9 | 49.5 | 66.5 | 54.6 | 57.5 | 51.6 | 57.9 | |||
| 2002 | 62 | 51.9 | 69.5 | 58.3 | 67.1 | 54.8 | 67 | |||
| 2003 | 60.7 | 53.1 | 67.9 | 56.3 | 60.4 | 54.6 | 63.9 | |||
| 2004 | 56.2 | 48.8 | 61.1 | 53 | 56.2 | 49 | 56.4 | 59.5 | 61.3 | 55.3 |
| 2005 | 54.5 | 50.2 | 60.9 | 48.6 | 50.9 | 52.9 | 51.3 | 57.1 | 53.6 | 55.4 |
| 2006 | 60.1 | 53 | 67.1 | 54.2 | 57.6 | 56.5 | 53 | 62.6 | 60.9 | 60.3 |
| 2007 | 58.9 | 52.2 | 65.1 | 55.5 | 60.2 | 52.6 | 51.5 | 60.4 | 64.1 | 61.8 |
| 2008 | 60.1 | 54.1 | 66.7 | 53.7 | 58.5 | 52 | 59.5 | 55.9 | 57.1 | 59.5 |
| 2009 | 59.4 | 52.4 | 64.9 | 58.1 | 58.7 | 51.2 | 55.5 | 58.1 | 60.4 | 58.3 |
| 2010 | 58.7 | 52.3 | 64.7 | 53.8 | 57.6 | 57 | 54 | 54.9 | 56.9 | 52.6 |
| 2011 | 61.3 | 55.6 | 66.5 | 55.2 | 59.7 | 62.6 | 58.1 | 60.5 | 55.5 | 54.3 |
| 2012 | 56.9 | 50.8 | 62.4 | 53.5 | 54 | 55.5 | 53.4 | 63.3 | 61.6 | 58.6 |
| 2013 | 58.5 | 52.8 | 65.4 | 59.1 | 56.7 | 53 | 53.9 | 56.4 | 56.1 | 56.8 |
| 2014 | 54.6 | 49.7 | 59.1 | 53.5 | 50.4 | 52.8 | 50.6 | 56 | 55.6 | 49.6 |
| 2015 | 61.5 | 55.1 | 66.5 | 61.7 | 57.3 | 53.5 | 63.7 | 61.3 | 62.9 | 63.3 |
| 2016 | 59.2 | 53.5 | 61.7 | 58.9 | 57.7 | 92.4 | 55.6 | 56.6 | 56.4 | 53.5 |
| 2017 | 56.6 | 53.3 | 61.4 | 57.2 | 55.7 | 57.4 | 55.4 | 60.1 | 61.8 | 55 |
| 2018 | 62.7 | 56.5 | 67.4 | 65.9 | 64.5 | 61.1 | 56.3 | 63.3 | 67.3 | 66.4 |
| 2019 | 60.3 | 55.8 | 65.4 | 57.7 | 62.3 | 55.5 | 55.9 | 57 | 66.3 | 58.2 |
| 2020 | 53 | 50.2 | 57.1 | 51.9 | 51.7 | 50.7 | 51.8 | 52.9 | 53.4 | 52.6 |
| 2021 | 58.7 | 53.2 | 63.8 | 63.4 | 60.8 | 53.8 | 55.9 | 63.9 | 69.7 | 59.8 |
| 2022 | 52.8 | 47.9 | 56.6 | 57.5 | 52.7 | 46.7 | 56.5 | 53.9 | 56.7 | 53.1 |
| 2023 | 67.2 | 59.8 | 73.5 | 67.9 | 70.2 | 62.2 | 62.9 | 64.1 | 64 | 69.6 |
Select a community in the legend to toggle it on or off in the chart. Peak concentrations are calculated as the annual 4th highest daily maximum of rolling 8-hour concentrations. The 10th percentile is the value below which 10% of the data may be found. The 90th percentile is the value below which 90% of the data may be found. The high O3 concentrations observed in 2016 in Fort McMurray were due to smoke from the Horse River wildfire.
Source: Government of Alberta
Source: Government of Alberta
Chart description
Line chart showing the change over time in peak O3 concentrations for large urban centres in Alberta, the provincial average, and the 10th and 90th percentile of all O3 monitoring stations in the province. The highest peak concentration was measured in Fort McMurray in 2016 with a value of 92.4 ppb due to smoke from the Horse River Wildfire.
- Examining the trends over more recent years and for all stations across the province provides additional information on the changes over time for the indicator. Between 2014 and 2023, 11 out of 26 stations meeting data completeness criteria saw statistically significant increasing trends in monthly average O3 concentrations including:
- Seven community stations (Edmonton East, Edmonton Lendrum, Fort Saskatchewan, and Bruderheim in the capital region; Calgary Southeast and Lethbridge in southern Alberta; and Grande Prairie in the northwest).
- Three regional monitoring stations in west central Alberta (Breton, Genesee, and Steeper).
- One station located near industrial facilities in northeastern Alberta (Wapasu).
- No other O3 monitoring stations showed a statistically significant trend over this period.
- A combination of factors is likely contributing to increasing trends in O3 observed at some monitoring stations. In recent years, a number of summertime smog episodes due to hot and humid weather conditions and substantial wildfire smoke episodes have contributed to elevated O3 concentrations. In addition, the change in concentrations of nitrogen oxides over time (see the NO2 Indicator for information on NO2 trends in Alberta) may also play a role as nitrogen oxides can both increase and decrease O3 concentration, depending on the level of air pollution and meteorology.
Seasonal variation
- The highest O3 concentrations typically occur between March and August because of high natural background O3 levels during spring and summer smog episodes. The variation in concentrations in 2023 (Figure 3) is similar to previous years.
Figure 3. Monthly variation in O3 for 2023, shown using bar plots of the median monthly value across all long-term air monitoring stations. Whiskers extend from the top of the bar to the maximum monthly value across all stations.
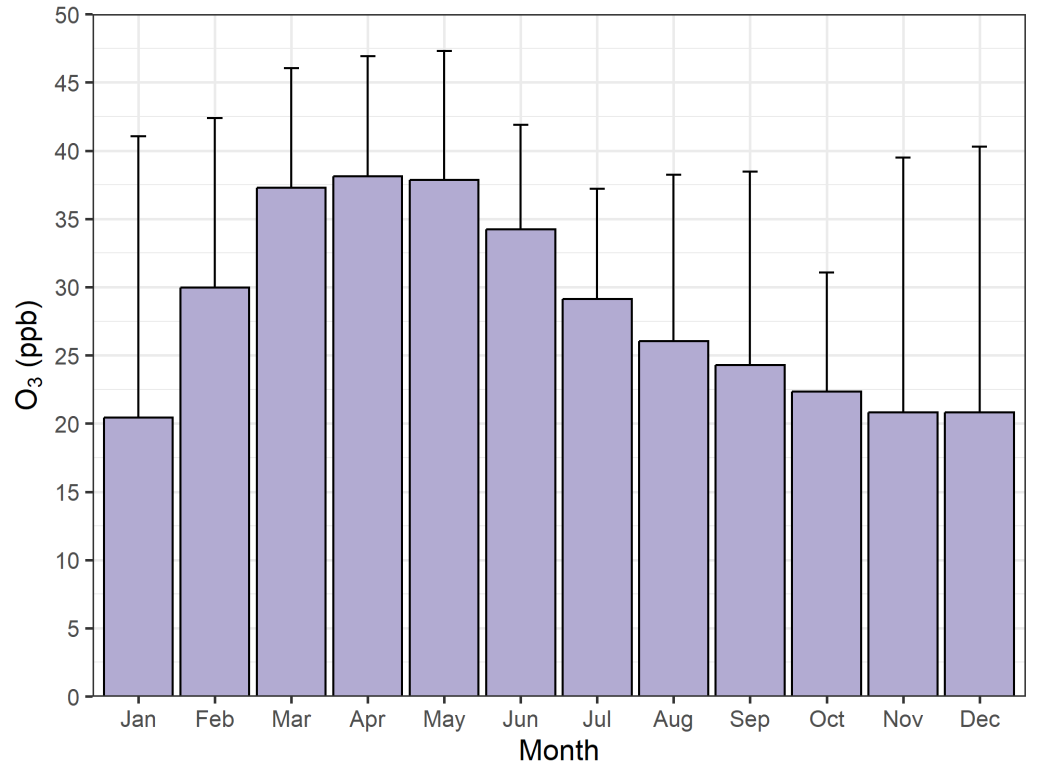
Source: Government of Alberta
Comparison to provincial objectives
- Alberta's Ambient Air Quality Objectives provide thresholds for over 30 airborne compounds to protect human and ecosystem health. The AAAQOs are used in the design of industrial facilities and to establish emissions requirements. The Alberta government tracks AAAQO exceedances and assesses the need for management action.
- In 2023, there were 125 exceedances of the one-hour daily maximum AAAQO for O3. Most of these exceedances were due to frequent wildfire smoke events in 2023 (103 exceedances). The AAAQO for O3 is 76 ppb for one-hour daily maximum periods based on the protection of human health.
- Over the previous 4 years (2019 to 2022), the number of AAAQO exceedances ranged from 2 exceedances in 2020 and 2022 to 29 exceedances in 2021.
Air quality reporting and resources
- Alberta reports annually on the status of air quality for existing regional air quality management frameworks (AQMFs) as well as the Canadian Ambient Air Quality Standards (CAAQS).
- O3 is one of the pollutants reported on through the South Saskatchewan Region (SSR) AQMF as well as the CAAQS.
- The most recent assessment results are available in Alberta’s Air Zone Reports.
- Published reports and scientific papers on air quality in Alberta are available via the Air Indicators landing page under ‘Related Publications’.
- Alberta also provides air quality data and information to the public through the near real-time AQHI website and provides access to quality assured data via Alberta’s Air Data Warehouse.
Focused study
Elevated O3 concentrations were reported in Alberta’s 2016-2018 assessment against the national Canadian Ambient Air Quality Standards (CAAQS) at monitoring stations in southern Alberta’s South Saskatchewan Region (SSR). In response, a focused study was conducted to investigate the potential contributing factors. Data from 2011 to 2019 for Calgary, Lethbridge, and Medicine Hat were analyzed including meteorology, pollutant concentrations, traffic patterns, and emissions data.
Key findings include:
- A combination of factors lead to elevated O3 concentrations in the SSR, including meteorological conditions and precursor emissions including nitrogen oxides (NOx) and volatile organic compounds (VOCs).
- Meteorological conditions such as lower wind speed and higher incoming solar radiation were found to result in longer periods of elevated O3
- Most elevated O3 episodes occurred in June and July, when there is typically higher incoming solar radiation and temperature (Figure 4). Daily maximum O3 most often occurred between 12 pm and 5 pm in the afternoon. These results are consistent with episodes being driven by photochemical production.
- Since meteorological conditions cannot be managed, regional air quality management actions should focus on managing O3 precursor (NOx and VOC) emissions.
- Previous air quality modelling studies have shown that O3 concentrations in urban centres are limited by VOCs, while more rural areas are limited by NOx. Therefore, strategies to reduce NOx in urban areas will have limited effect in reducing O3, and may actually increase it.
Figure 4: Number of elevated O3 episodes recorded at the Calgary, Lethbridge, and Medicine Hat monitoring stations from 2011 to 2019
Chart data table
| Month | Number of episodes |
|---|---|
| Apr | 5 |
| May | 8 |
| Jun | 29 |
| Jul | 17 |
| Aug | 5 |
| Sep | 3 |
Episodes were defined as sample days with daily maximum 8-hour rolling average O3 concentrations > 56 ppb and not influenced by exceptional events, such as wildfire smoke.
Source: Government of Alberta
Accessible chart description
Bar chart showing the number of elevated O3 days recorded between April and September at the Calgary, Lethbridge and Medicine Hat monitoring stations from 2011 to 2019.
The majority of episodes (69%) occurred in June and July when there is typically higher incoming solar radiation and temperature.
Previous
Fine particulate matter