Introduction
A population estimate is a measure of the current or historical population at a particular point in time.
- As of January 1, 2024, Alberta’s population was 4,800,768.
- Alberta’s population growth continues to accelerate. In the 12 months preceding January 1, 2024, the province’s population expanded by 202,324 people, or 4.4%.
- This represents a significant increase from the previous year (3.0% in 2022-2023) and the highest January 1st annual growth rate since 1981. Alberta’s population expanded by 44,360 residents over the fourth quarter of 2023, or 0.93%.
Image 1. Alberta components of population change, Q4 of 2023
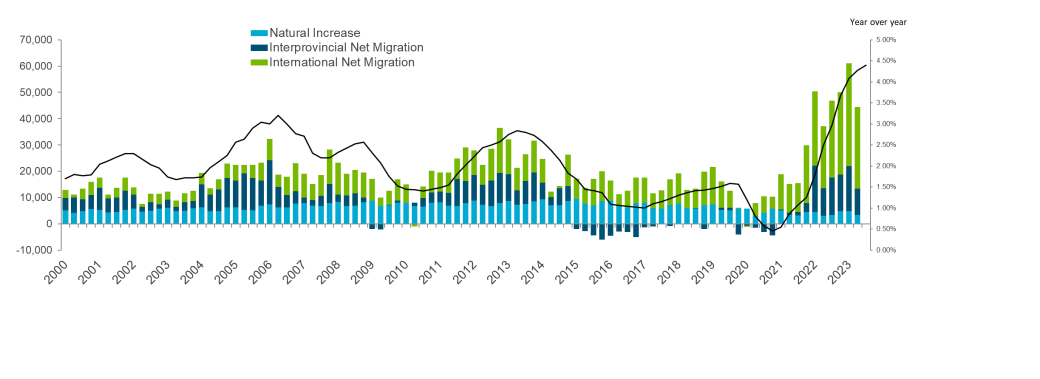
Other highlights include:
- In comparison, Canada’s growth rate was 0.6% in the fourth quarter. Among the 4 largest provinces, Ontario had the next fastest growth at 0.69%, followed by BC (0.52%) and Quebec (0.41%).
- International net migration was the biggest driver of Alberta’s growth in the fourth quarter, contributing 0.65%, followed by net interprovincial migration at 0.21% and natural increase with 0.07%.
- This was the sixth quarter in a row that Alberta registered the highest net interprovincial migration gains in Canada, adding a net of 9,913 new residents.
- Alberta was the only province to register large net inflows of interprovincial migrants.
Table 1. Population of provinces and territories as of January 1, 2024, and growth rates since January 1, 2023
| Province/territory | Population January 1, 2024 | Population January 1, 2023 | Y/Y Growth rate 2023-2024 |
|---|---|---|---|
| Canada | 40,769,890 | 39,498,018 | 3.22% |
| NL | 540,552 | 534,964 | 1.04% |
| PEI | 176,162 | 169,935 | 3.66% |
| NS | 1,069,364 | 1,040,195 | 2.80% |
| NB | 846,190 | 820,943 | 3.08% |
| QC | 8,984,918 | 8,767,038 | 2.49% |
| ON | 15,911,285 | 15,378,179 | 3.47% |
| MB | 1,474,439 | 1,432,674 | 2.92% |
| SK | 1,225,493 | 1,194,869 | 2.56% |
| AB | 4,800,768 | 4,598,444 | 4.40% |
| BC | 5,609,870 | 5,431,355 | 3.29% |
| YT | 45,387 | 44,386 | 2.26% |
| NWT | 44,741 | 44,515 | 0.51% |
| NVT | 40,721 | 40,521 | 0.49% |
International migration
- International migration added 31,037 net new residents to Alberta in the fourth quarter of 2023. This figure includes both permanent and temporary immigration (NPRs) from sources outside the country.
- Compared to the same period last year, 2023 fourth quarter international migration was higher by nearly 7,500.
- Alberta welcomed 13,986 immigrants in the fourth quarter, representing 13.9% of national arrivals. The share of national arrivals was 2 percentage points higher when compared to the same period last year (11.9%).
- In comparison, 100,472 immigrants made their home in Canada in the fourth quarter. By December 31, 2023, Canada had landed 471,771 immigrants. The national target for the 2023 calendar year was 465,000 arrivals.
- Alberta saw record setting fourth quarter net inflows of non-permanent residents.
- Alberta welcomed 18,487 NPRs, exceeding 2022’s fourth quarter by about 3,400 people.
- Of these, 60% held only a work permit, 15% held only a study permit and 9% held both.
- To reduce the proportion of temporary residents in the national population over the next 3 years, the federal government will introduce caps on the number of new NPR arrivals when it announces immigration targets this fall.
- As of January 1, 2024, almost 200,000 NPRs were Alberta residents. This stock of temporary immigrants was mostly comprised of work permit holders (59%) and study permit holders (24%) while 8% held both a study and work permit. Asylum claimants comprised about 5% of all NPRs.
- With the war continuing in Ukraine, people coming in under the Canada-Ukraine Authorization for Emergency Travel (CUAET) are part of this stock. Most people admitted under the CUAET are permit holders, with the rest consisting of family members living with permit holders.
Table 2. Number of non-permanent residents by type
| January 1 2023 | October 1 2023 | January 1, 2024 | ∆Q/Q | ∆Y/Y | |
|---|---|---|---|---|---|
| Total non-permanent residents | 118,871 | 178,754 | 197,241 | 18,487 | 78,370 |
| Total asylum claimants | 4,778 | 7,437 | 9,531 | 2,094 | 4,753 |
| Total, permit holders and their family members | 114,093 | 171,317 | 187,710 | 16,393 | 73,617 |
| Work permit holders only | 64,510 | 105,311 | 116,404 | 11,093 | 51,894 |
| Study permit holders only | 35,661 | 43,742 | 46,538 | 2,796 | 10,877 |
| Work and study permit holders | 8,167 | 13,611 | 15,302 | 1,691 | 7,135 |
| Other | 5,755 | 8,653 | 9,466 | 813 | 3,711 |
Interprovincial migration
- Alberta saw the largest net gain in interprovincial migration in 2023 than any other year, adding 55,107 people. This was the largest gain in interprovincial migration nationally since comparable data became available in 1972.
- Alberta has been recording gains in population from interprovincial migration since 2022, a reverse of the trend seen from 2016 to 2021, when more people left the province than arrived from other parts of Canada.
- Alberta was the only province to register significant net gains from interprovincial migration, adding 9,913 people in the fourth quarter.
- This was the sixth quarter in a row that Alberta registered the highest net interprovincial gains.
- On a net basis, Alberta gained the most interprovincial migrants from Ontario (3,812), BC (2,991), Manitoba (1,058) and Saskatchewan (763).
Natural increase
- Natural increase added 3,410 people in the fourth quarter, the balance of 12,375 births and 8,965 deaths.
- Of the provinces, Alberta and Manitoba recorded the highest natural growth rates at 0.072% and 0.070%, respectively.
Image 2. Net population movement for Alberta (October 1, 2023, to December 31, 2023)
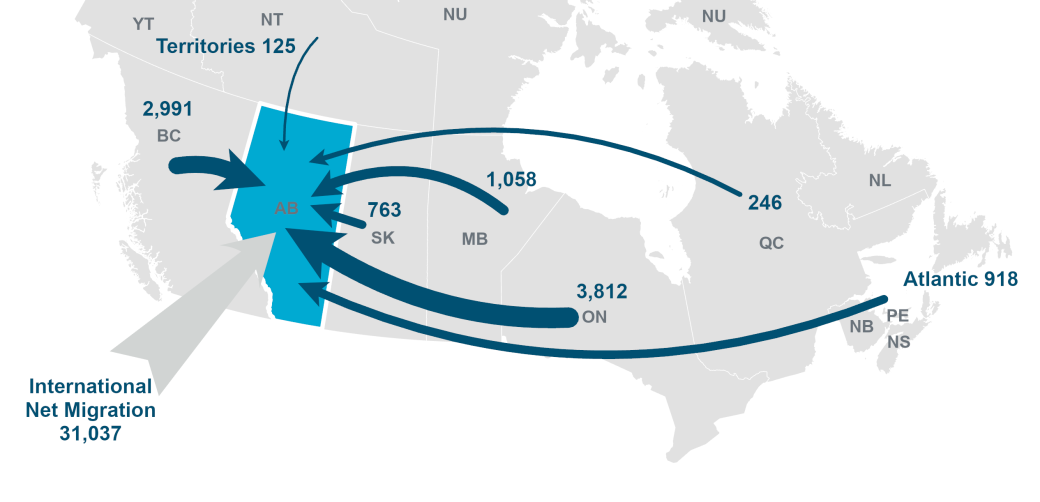
Source: Statistics Canada
Table 3. Interprovincial migration statistics (October 1 to December 31, 2023)
| Province/ territory | In | Out | Net | Outflow to Alberta | Inflow from Alberta | Net flow to Alberta |
|---|---|---|---|---|---|---|
| PEI | 628 | 854 | -226 | 106 | 55 | 51 |
| NS | 3,022 | 2,164 | 858 | 607 | 243 | 364 |
| NB | 2,757 | 2,455 | 302 | 454 | 171 | 283 |
| QC | 4,134 | 5,480 | -1346 | 618 | 372 | 246 |
| ON | 12,126 | 15,774 | -3,648 | 6,102 | 2,290 | 3,812 |
| MB | 2,198 | 3,479 | -1,281 | 1,375 | 317 | 1,058 |
| SK | 3,960 | 5,878 | -1,918 | 2,971 | 1,392 | 1,579 |
| AB | 17,556 | 7,643 | 9,913 | 0 | 0 | 0 |
| BC | 7,892 | 10,620 | -2,728 | 6,018 | 3,027 | 2,991 |
| YT | 182 | 187 | -5 | 60 | 35 | 25 |
| NWT | 155 | 346 | -191 | 141 | 52 | 89 |
| NVT | 56 | 262 | -206 | 21 | 10 | 11 |
Detailed population tables
- Population estimates and components of growth and population by age and sex (Excel files updated September 27, 2023)
- Municipal (Census Subdivision) Population Estimates (2016 to 2022) (Excel file updated January 11, 2023) Municipal Population Estimates for 2023 will be released on May 22, 2024 and will incorporate information from the 2021 Census
- Components of Migration / Mobility – Alberta, 19 Census Divisions and 8 Economic Regions
- Vital statistics (births and deaths) – Alberta, 19 Census Divisions and 8 Economic Regions
Population change components
Population change is a result of the relationship between births, deaths and migration.
Definitions
- Natural increase – The difference between the number of births and deaths.
- Migration (net) – The difference between movements into a region and those out of a region.
- International migration (net) – This includes immigrants, emigrants, non-permanent residents (net), temporarily abroad (net) and returning migrants:
- Immigrants – permanent residents moving to Canada from other countries and landing in Alberta.
- Emigrants – people permanently leaving Canada
- Non-permanent residents (net) – in and out movements of foreign students, workers and refugee claimants, and the families of each of these categories
- Temporarily abroad (net) – movements of people who do not have a residence in Canada, but intend to return
- Returning migrants – former emigrants who have returned to Canada to live
- Interprovincial migration (net) – The movement between the provinces and territories of Canada, which equals 0 at the national level.
- Intraprovincial migration (net) – The movement within the province of Alberta, which equals 0 at the provincial level.
Archived publications
These detail Alberta population estimates between 2002 and 2019 on a quarterly basis.
Archived annual report: 2021-22 Annual Population Report (January 19, 2022)
Sign up for updates
Subscribe to get our statistical publications by email
Contact
General OSI enquiries
Hours: 8:15 am to 4:30 pm (open Monday to Friday, closed statutory holidays)
Phone: 780-427-2071
Toll free: 310-0000 before the phone number (in Alberta)
Fax: 780-426-3951
Email: [email protected]
Media enquiries
Contact the Treasury Board and Finance Spokesperson.