Government mail service may be affected by the Canada Post labour disruption. Learn about how critical government mail will be handled.
About the indicator
Water yield is an estimate of freshwater input (for example, rain, snow and snowmelt) flowing into streams and rivers. Many factors affect water yield, including precipitation, temperature, watershed size and location, and primary water source (in other words, rainfall or snowmelt).
Water yield also varies spatially across the province and seasonally throughout the year. For example, winter flows between January and March are typically low as precipitation is falling as snow and ice forms on rivers. Water flow peaks in the spring and early summer.
The amount of and any changes in water yield can affect both natural ecosystems and communities. For example, spring flows between April and June that are driven by snowmelt and rain are important for water management strategies such as filling reservoirs to redistribute water to typically lower-flow seasons. July to September summer flows are critical for economic sectors such as agriculture, and recreational pursuits such as fishing and boating. October to December represent autumn flows, which are typically low as temperatures drop and precipitation shifts from rain to snow. Winter flows (January to March) are typically the lowest of the year and are maintained by groundwater stores from the previous spring and summer, but are critical for aquatic ecosystems and municipal uses.
Surface water quantity is evaluated by the Government of Alberta using data from hydrometric stations across the province, which are monitored in partnership with the Water Survey of Canada.
Two types of water quantity parameters are evaluated for each hydrometric station:
- Annual water yields – tell us the total amount of water every year (October 1 to September 30).
- Seasonal water yields – give us an indication of winter, spring, summer and autumn water availability.
Annual and seasonal yields on unregulated rivers are primarily affected by climate variability, while regulated rivers may be affected by both climate variability and water management strategies (for example, hydroelectric dams).
This indicator reports on annual and seasonal water yields for 2020 as well as trends in water yield across Alberta over a 40-year period (1981 to 2020).
Results
-
2020 water quantity relative to historic average
The 2020 annual and seasonal yields are compared to the long-term mean (1981 to 2019) yields at each hydrometric station – this identifies if water yield in 2020 was more or less than the average over the historical period. For context, water yield in 2020, average water yield over 1981 to 2019, and coefficient of variation are given for annual, winter, spring, summer and autumn (Tables 1 to 5) . Coefficient of variation is a measure of variability, calculated as the standard deviation divided by the mean value. In general, watersheds that are smaller and have a low average yield tend to have a higher coefficient of variation, and flows may vary substantially year-to-year. Conversely, watersheds that are larger and have a higher average yield tend to have a lower coefficient of variation, and deviate very little year-to-year.
Annual
- Above-average annual yields were reported for all stations for 2020, compared to the long-term (1981 to 2019) means (Figure 1).
- In general, the largest departures from the mean water yield were found at hydrometric stations in the Peace, Athabasca, and North Saskatchewan River Basins, where yields at numerous stations were > 100 mm above average and several of these are large watersheds (> 20,000 km2).
- Two smaller watersheds (2) in the upper Oldman River Basin were also more than 100 mm above average for 2020.
- In the Peace River Basin, the Wapiti River near Grande Prairie (07GE001), Smoky River at Watino (07GJ001), Waskahigan River near the Mouth (07GG001) exceeded 150 mm above normal, while the Peace River at Peace River (07HA001) was 116 mm above average in 2020.
- Similarly, water yields more than 100 mm above average occurred at 4 stations in the upper and central Athabasca River Basin, the Athabasca River at Hinton (07AD002), Pembina River at Jarvie (07BC002), Athabasca River near Jasper (07AA002), and Athabasca River at Athabasca (07BE001).
- In the North Saskatchewan River Basin, 2 headwater streams, Prairie Creek near Rocky Mountain House (05DB002) and Clearwater River near Dovercourt (05DB006) as well as North Saskatchewan River at Edmonton (05DF001) were more than 100 mm above average.
Winter yields (January to March)
- Winter flows between January and March (JFM) are typically the lowest of the year as precipitation is falling and storing as snow and many rivers are partially or completely ice-covered. Winter flows are maintained by groundwater stores resulting from groundwater recharge in the previous spring-summer and are generally not reflective of winter precipitation events.
- Both above- and below-average winter yields were found for 2020, compared with the long-term (1981 to 2019) mean (Figure 2).
- Above-average yields dominated hydrometric stations in the North Saskatchewan and Athabasca River Basins, where a range of 1 to 9 mm above average were reported.
- Hydrometric stations in the Milk, Bow, and Battle River Basins and at the South Saskatchewan River at Medicine Hat (05AJ001) and Slave River at Fitzgerald (07NB001) reported below-average winter yield, ranging from 2 to 10 mm below normal.
- A mix of above- and below-average winter yields were found for the Oldman, Red Deer, and Peace River Basins.
Spring yields (April to June)
- Widespread above-average water yields occurred between April and June (AMJ) 2020 with several stations exceeding 100 mm above normal for this period, including 3 in the Peace, 2 in the North Saskatchewan, and 1 in each of the Athabasca and Oldman watersheds (Figure 3).
- Six stations reported below-average spring water yield, including 4 regulated stations, and of these only the Slave River at Fitzgerald (07NB001) in northeastern Alberta is a large watershed (> 20,000 km2).
- In the Milk and South Saskatchewan River Basins, spring water yield ranged from 7 mm below average to 124 mm above average, with the majority of hydrometric stations reporting > 20 mm above average yield.
- The North Saskatchewan, Battle, Beaver, and Athabasca River Basins are dominated by high spring yield, ranging from 12 to 125 mm above average, and large drainage areas (> 20,000 km2) between 37 and 58 mm above average.
- Two watersheds in the central Peace Basin reported slightly below average yield and the upper Peace is dominated by high spring yield of more than 50 mm above average.
Summer yields (July to September)
- A mix of above- and below-average summer yields between July and September (JAS) were seen across Alberta (Figure 4).
- Generally, the greatest departures from the mean were found in central and northern Alberta.
- The 15 large watersheds (> 20,000 km2) were characterized by above-average summer yield, ranging from 3 mm above average at the Red Deer River near Bindloss (05CK004) to 61 mm above average at the Peace River at Dunvegan Bridge (07FD003).
- Below-average yields were predominantly found in smaller watersheds (2) and in the South Saskatchewan and Milk River Basins in southern Alberta.
- The greatest departures from average summer yield occurred in 3 medium-sized watersheds in northern Alberta, all exceeding 100 mm above average. These are the Steepbank River near Fort McMurray (07DA006), Smoky River above Hells Creek (07GA001), and Birch River below Alice Creek (07KE001).
Autumn yields (October to December)
- Above-average autumn yields were seen across Alberta, with the exception of 6 stations which were below-average for autumn 2020 (Figure 5).
- Three of the stations reporting below-average yield are regulated, the Little Bow River at Carmangay (05AC003), St. Mary River at International Boundary (05AE027), and Bow River at Calgary (05BH004).
- Three unregulated stations reported below-average yield, including the North Saskatchewan River at Whirlpool Point (05DA009), a glaciated headwater basin.
- Large watersheds (> 20,000 km2) reported above-average autumn yield, ranging from 1 to 23 mm above normal.
- The greatest positive departures from average yield (> 20 mm) were found in watersheds in the upper Peace and upper Oldman River Basins.
-
Long-term trends of water yield (1981-2020)
Annual
- Trends in annual water yield from 1981 to 2020 show largely increasing yields in southern Alberta and a mix of increasing and decreasing yields in northern Alberta (Figure 6).
- Increasing trends were detected for all hydrometric stations in the Oldman, Bow, Red Deer, North Saskatchewan and Beaver River Basins.
- The greatest increases in yield (> 10 mm/decade) were found in mountain headwater rivers of the Oldman, North Saskatchewan and Athabasca River Basins; however, only the trend at the Clearwater River near Dovercourt (05DB006) was found to be significant at p
- A significant increasing trend was detected at the South Saskatchewan River at Medicine Hat (05AJ001), which represents the flow over the entire watershed including the Bow and Oldman River Basins.
- The North Saskatchewan River Basin is dominated by increasing trends, while a slight decreasing trend was found for the Battle River near Ponoka (05FA001). However, only the trend on the Clearwater River near Dovercourt (05DB006) is statistically significant.
- In the Athabasca River Basin, increasing yield was detected in the upper region and decreasing yield in the central Athabasca, while the lower Athabasca saw increasing trends, including a significantly increasing trend at the Clearwater River at Draper (07CD001).
- The upper Peace River Basin is characterized by increasing annual yield, while decreasing trends were found in the central and lower portions of the watershed, including the Peace River at Peace Point (07KC001), delineating the entire Peace River Basin.
- Additionally, a slight decreasing trend was detected for the Slave River at Fitzgerald (07NB001).
Winter trends (January to March)
- Mixed increasing and decreasing trends in winter yield were detected across the province for 1981 to 2020, including 7 significantly increasing and 1 significantly decreasing trend (Figure 7).
- Trend magnitudes are small, ranging from -0.7 mm/decade at the Milk River at Milk River (11AA005) and Battle River near Ponoka (05FA001) to 2.3 mm/decade at the Peace River at Peace River (07HA001), with the majority of stations reporting low magnitude trends, between -0.5 to 0.5 mm/decade.
- Largely increasing trends were detected for large watersheds (> 20,000 km2).
- Despite increases in winter flow for hydrometric stations in the Oldman and Bow River Basins, a slight decreasing trend was detected for the Bow River near the Mouth (05BN012) and South Saskatchewan River at Medicine Hat (05AJ001).
- Increasing trends were detected for the Red Deer River near Bindloss (05CK004), North Saskatchewan River at Edmonton (05DF001) Athabasca River below Fort McMurray (07DA001), and the Slave River (07NB001).
- A decreasing trend was detected for the Peace River at Peace Point (07KC001) despite increasing trends in all other stations within the Peace River Basin.
Spring trends (April to June)
- Increasing and significant trends in spring yield dominated much of the province for 1981 to 2020, except for the lower Athabasca and central and lower Peace River Basins (Figure 8).
- Increasing trends were detected for the upper Peace and upper and central Athabasca including several significant trends. The greatest trend magnitudes (> 14 mm/decade) in these two watersheds are found at the Muskeg River near Grande Cache (07GA002), Smoky River above Hells Creek (07GA001), and Freeman River near Fort Assiniboine (07AH001).
- In central and southern Alberta watersheds, trends are largely increasing, with the largest trend magnitudes (> 20 mm/decade) at Waterton River near Waterton Park (05AD003) and Drywood Creek near the Mouth (05AD010).
- Few stations in this region have decreasing trends, 2 of which are in small (2) regulated rivers.
- Increasing trends were detected for most large watersheds (> 20,000km2) , including the Athabasca River below Fort McMurray (07DA001), North Saskatchewan River at Edmonton (05DF001), Red Deer River at Bindloss (05CK004) and South Saskatchewan River at Medicine Hat (05AJ001).
- Large watersheds in the Peace River Basin are dominated by decreasing trends, including the Peace River at Peace Point (07KC001).
Summer trends (July to September)
- Trends in summer water yield are a mix of increasing and decreasing over 1981 to 2020 with all major watersheds dominated by decreasing trends, including 18 significantly increasing and 5 significantly decreasing trends (Figure 9).
- The largest decrease is found in Twelve Mile Creek near Cecil (05BN002) at -12.6 mm/decade and the largest increase at the Oldman River near Brocket (05AA024), both regulated rivers and both trends are statistically significant. The vast majority of trends range from -5.0 to 5.0 mm/decade.
- Large watersheds (> 20,000km2) in the South Saskatchewan River Basin have increased over 1981 to 2020, while those in the Red Deer, North Saskatchewan, Athabasca, and Peace River Basins have largely decreased, including the Red Deer River near Bindloss (05CK004), North Saskatchewan River at Edmonton (05DF001), Athabasca River below Fort McMurray (07DA001), and Peace River at Peace Point (07KC001).
- The Clearwater River at Draper (07CD001), a large tributary to the lower Athabasca, saw a significant increase in yield over 1981 to 2020.
- Across central and southern Alberta, weak increases and decreases were seen in both regulated and unregulated rivers, and medium and small (2) watersheds.
Autumn trends (October to December)
- Increasing autumn yield trends were detected for most hydrometric stations in southern Alberta, and mixed increasing and decreasing trends were seen in central and northern Alberta, this includes 10 significantly increasing trends, largely in southern Alberta, and 2 significantly decreasing trends (Figure 10).
- Trend magnitudes range from -2.2 mm/decade at Peace River at Peace River (07HA001), albeit not significant, to a significant increase of 4.6 mm/decade at the St Mary River at International Boundary (05AE027).
- Large watersheds (> 20,000km2) in central and southern Alberta have increasing trends over 1981 to 2020, including significant increases on the South Saskatchewan River at Medicine Hat (05AJ001) and Bow River near the Mouth (05BN012), and increases on the Red Deer River near Bindloss (05CK004), and North Saskatchewan River at Edmonton (05DF001).
- Decreasing trends dominated large watersheds in northern Alberta, including a significant decrease on the Peace River at Peace Point (07KC001), and decreases on the Athabasca River below Fort McMurray (07DA001), and Slave River at Fitzgerald (07NB001).
- Mountain headwater rivers were predominantly increasing and there was a mix of increasing and decreasing trends for both regulated and unregulated rivers.
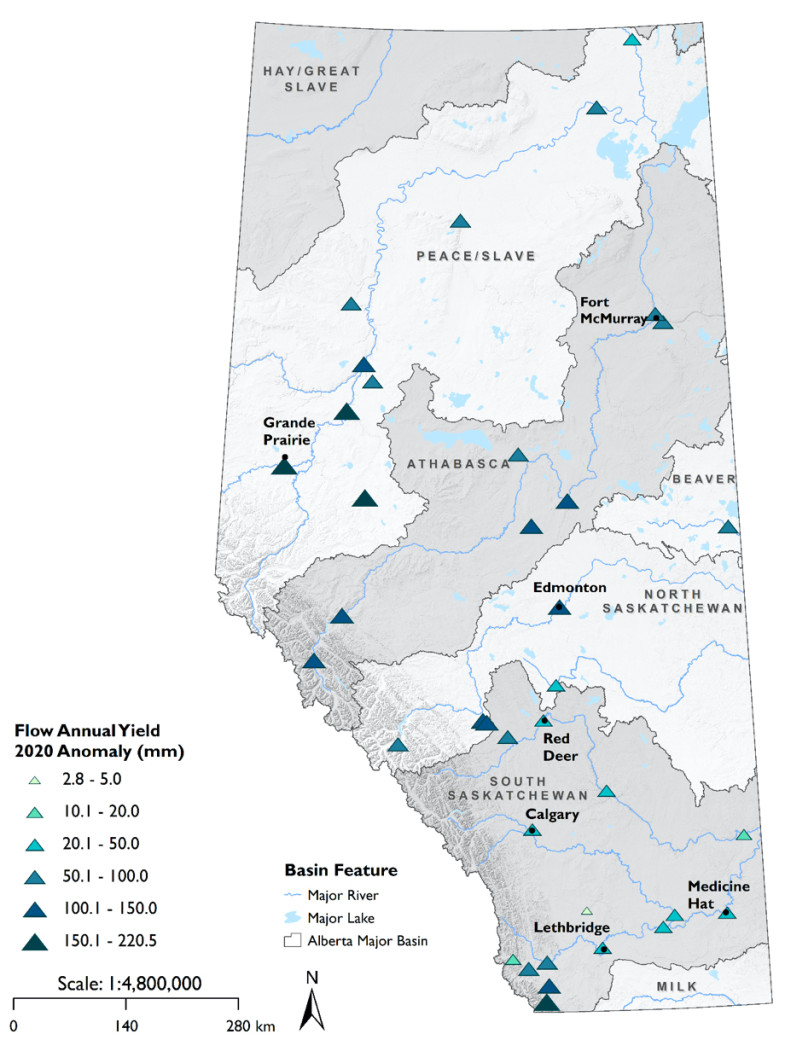
Figure 1. Annual water yield anomalies for 2020, relative to long term (1981-2019) mean
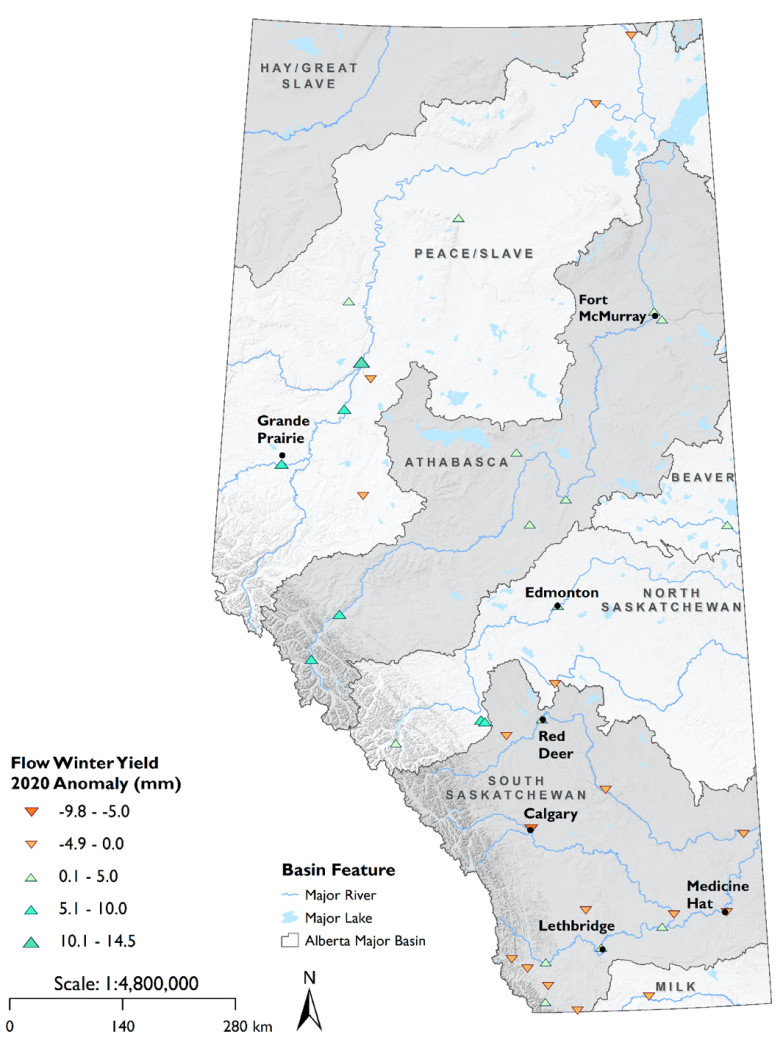
Figure 2. Winter (JFM) water yield anomalies for 2020, relative to long term (1981-2019) mean
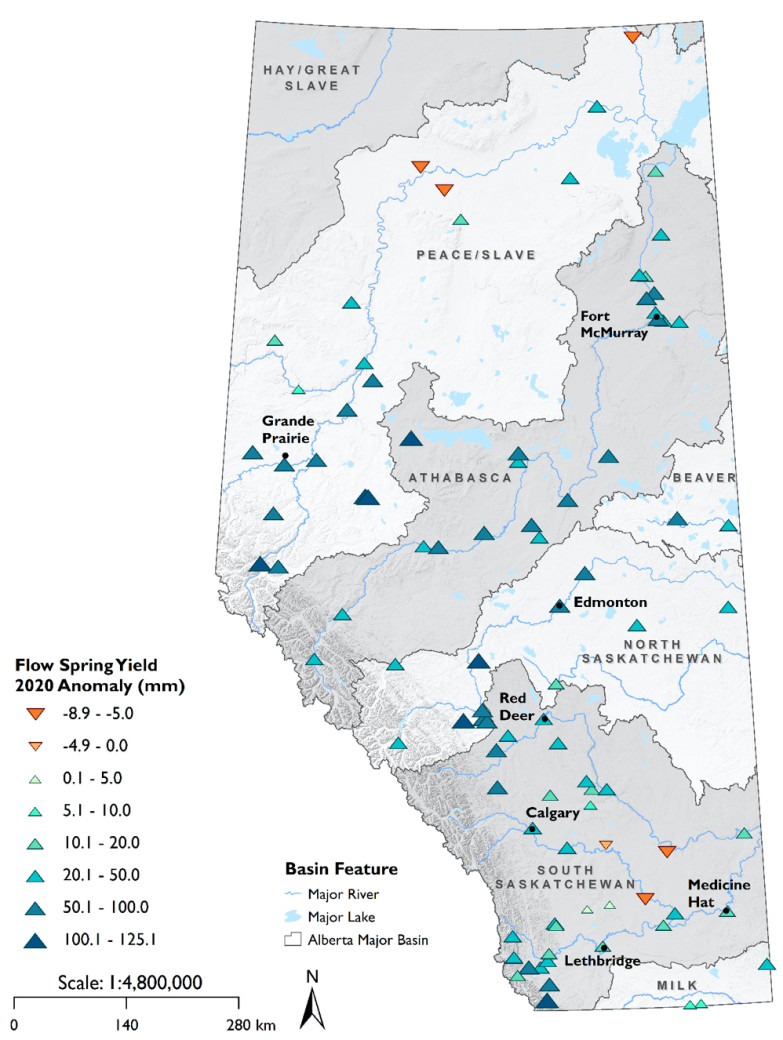
Figure 3. Spring (AMJ) water yield anomalies for 2020, relative to long term (1981-2019) mean
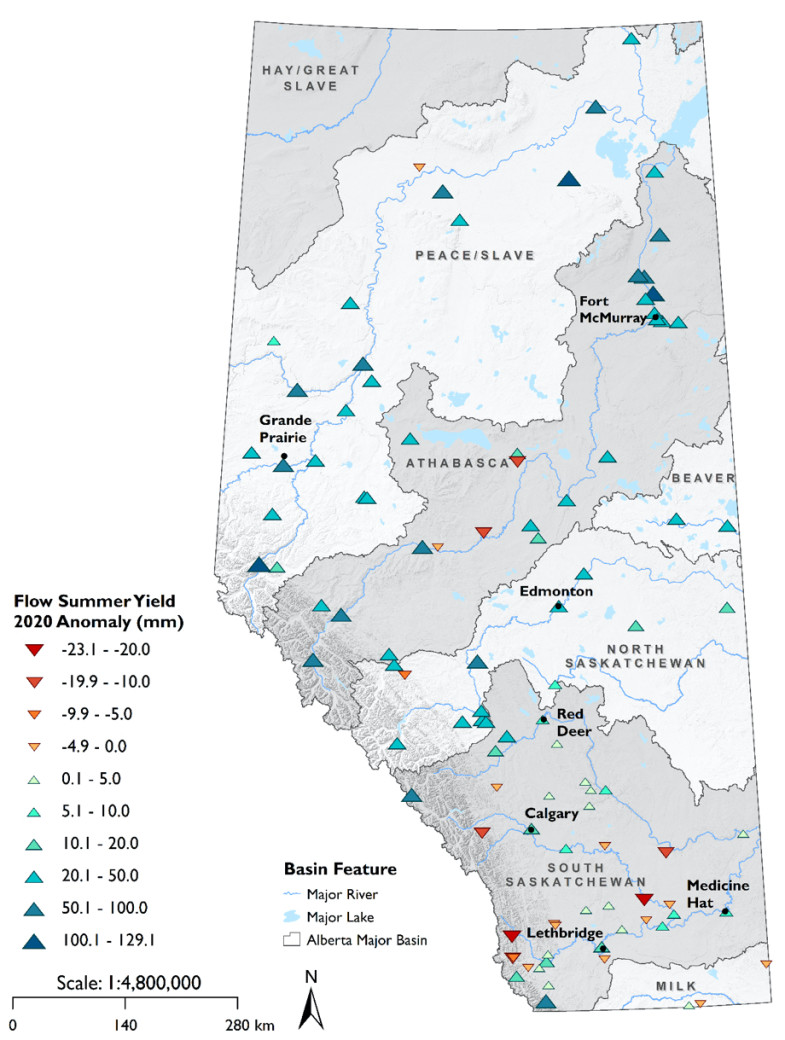
Figure 4. Summer (JAS) water yield anomalies for 2020, relative to long term (1981-2019) mean
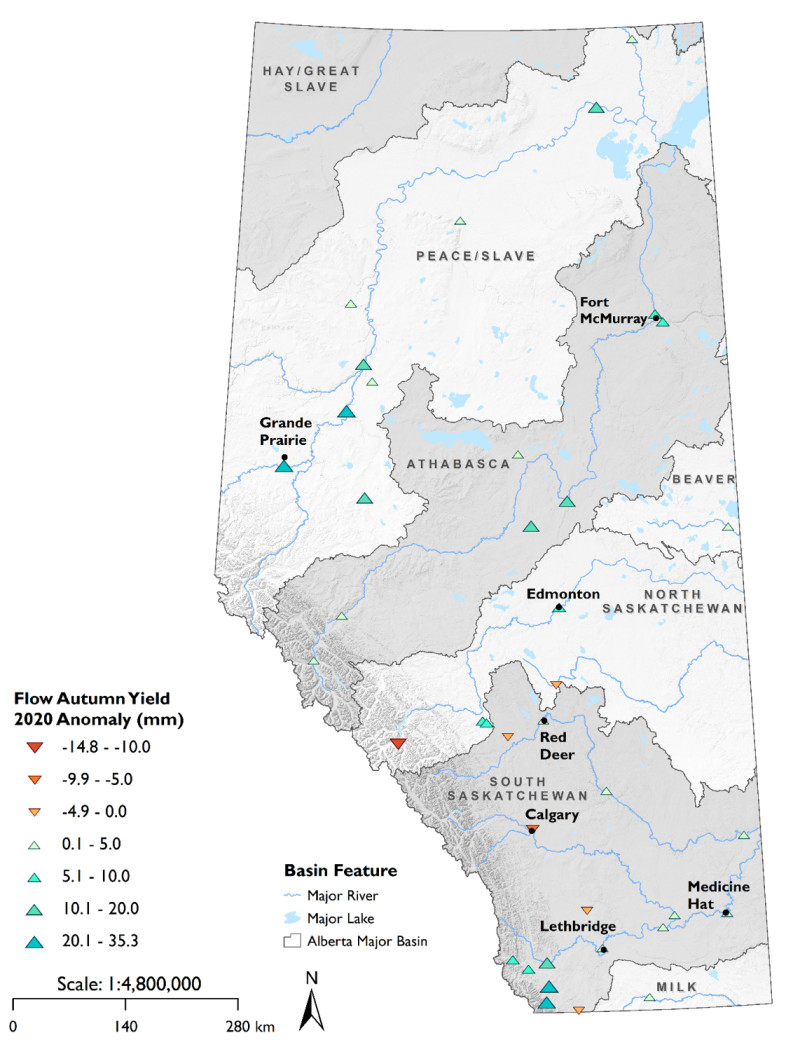
Figure 5. Autumn (OND) water yield anomalies for 2020, relative to long term (1981-2019) mean
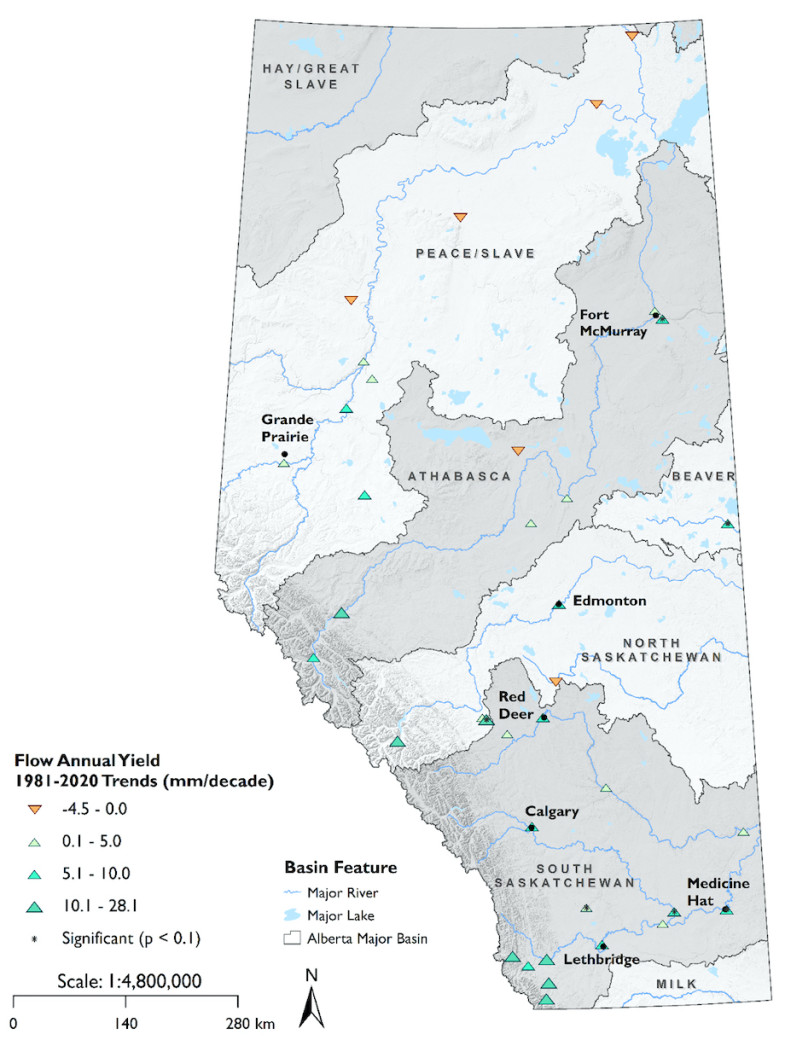
Figure 6. Trends in annual water yield over 1981-2020
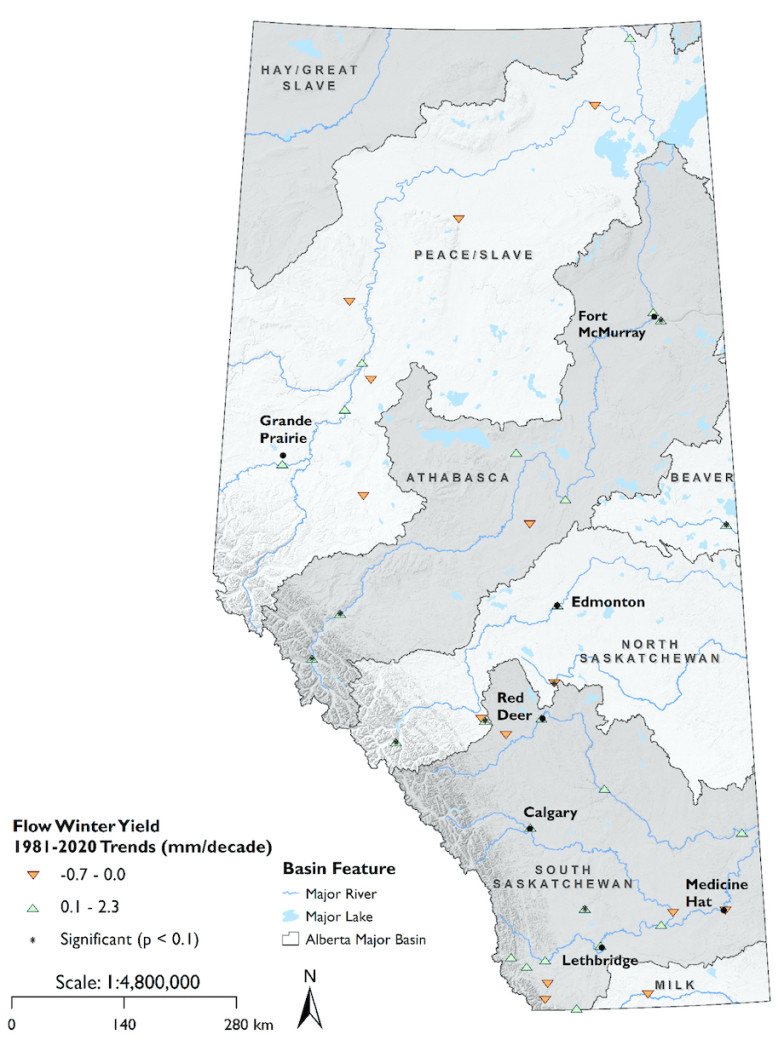
Figure 7. Trends in winter (JFM) water yield over 1981-2020
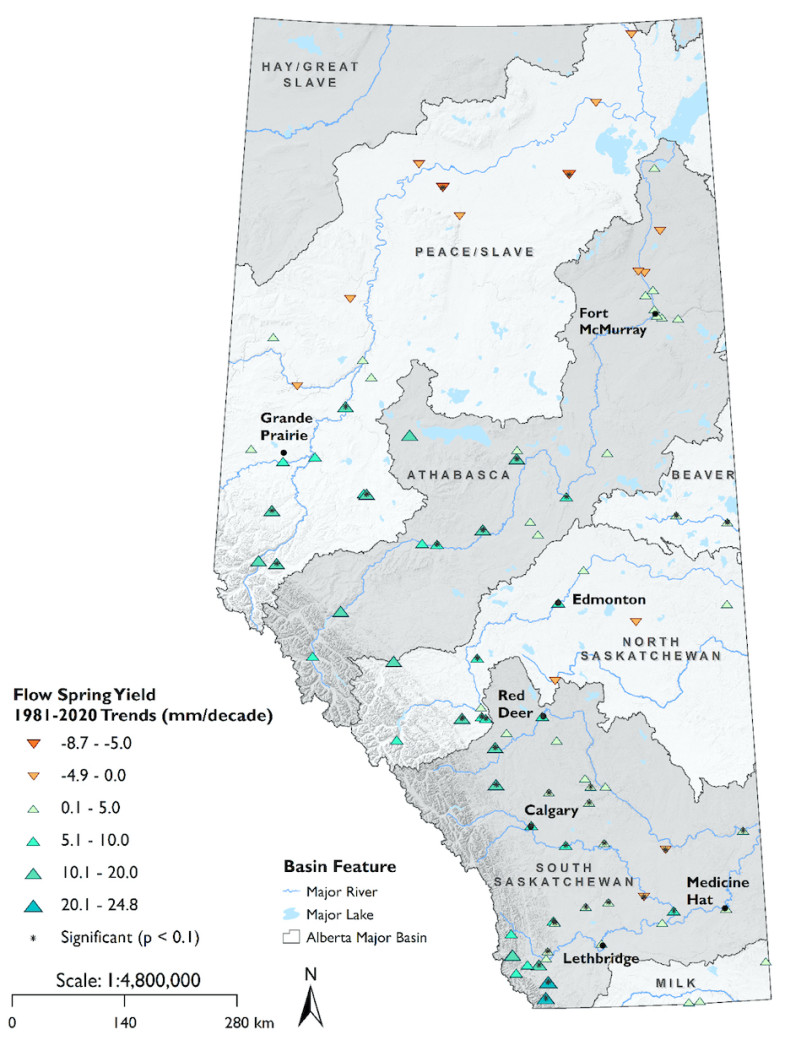
Figure 8. Trends in spring (AMJ) water yield over 1981-2020
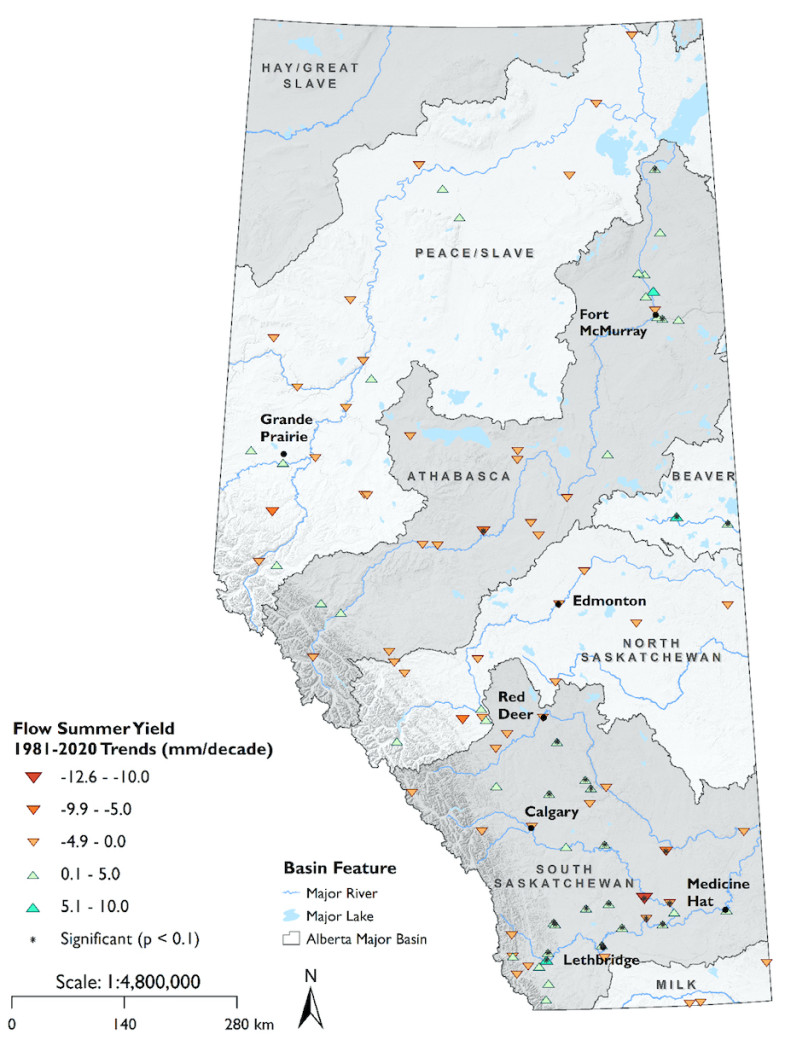
Figure 9. Trends in summer (JAS) water yield over 1981-2020

Figure 10. Trends in autumn (OND) water yield over 1981-2020
Data collection and analysis
Surface water quantity is evaluated by AEP using data from hydrometric stations across the province, which are monitored in partnership with the Water Survey of Canada.
We selected stations that have long-term data records of at least 40 years (1981 to 2020) and no more than 3 years of missing data. Streamflow monitoring stations are either operated annually or seasonally (April to October). There are a mix of stations on the mainstem of major rivers including the Slave, Peace, Athabasca, North Saskatchewan, Beaver, Red Deer, Bow, Oldman and South Saskatchewan Rivers, and their tributaries.
Water quantity indicators are evaluated annually and seasonally. The number of stations included in analyses varies annually and seasonally due to data availability, and include 37 for annual, 39 for winter and autumn, 93 for spring and 102 for summer (Table 6).
Watershed areas, the land surface areas that contribute to a given river, range in size from larger areas encompassing more than 20,000 km2 to smaller watersheds with an area less than 1000 km2.
Regulated rivers are those that are controlled by a structure such as a hydroelectric dam or diversion dam, and many have accompanying reservoirs. A river is considered regulated if any point upstream of the hydrometric station is regulated. Thirty-three of the stations included in analyses are regulated; 15 of which are monitored annually and 9 are large rivers (> 20,000 km2).
Streamflow is often reported as a flow rate in cubic meters per second (m3/s). For this analysis, we convert either the annual or seasonal mean flow rate for the stations used to a water yield in millimetres (mm). A water yield standardizes the annual total streamflow volume to the size of the watershed. This conversion allows comparison among watersheds of different size as streamflow on large rivers is orders of magnitude greater than smaller tributaries.
Water quantity trends at each station were evaluated using the Mann-Kendall nonparametric test for trend performed in R2 using the ‘zyp’ statistics package3. Trend magnitudes were determined using Sen’s slope estimator. This is a statistical test that shows if yields have decreased, stayed the same or increased for the period 1981 to 2020. A significance value attached to the tests shows how robust the trends detected by the analysis are. For this analysis, a significance value of less than 0.1 indicates a statistically significant trend.
Footnotes:
- There was a structural failure on the St. Mary Canal which diverts water to the Milk River, in May 2020 and repairs were completed October 2020. Consequently, these two rivers were excluded from annual, spring, and summer analyses (https://www.mrwcc.ca/)
- R Core Team (2020). R: A language and environment for statistical computing. R Foundation for Statistical Computing, Vienna, Austria. URL https://www.R-project.org/.
- https://CRAN.R-project.org/package=zyp
Water monitoring
Access data and learn about how Alberta’s Environmental Science Program monitors Alberta’s water quality and quantity: Environmental monitoring.