Government mail service may be affected by the Canada Post labour disruption. Learn about how critical government mail will be handled.
About the indicator
Trophic status refers to the overall level of biological productivity within a lake and is a key characteristic of water quality. Increasing nutrients from a variety of human sources is causing elevated algal production in many surface waters across North America and is threatening aquatic ecosystems and water that we depend upon. Trophic status is an important water quality indicator for Alberta lakes and reservoirs.
Limnologists (lake scientists) assess the trophic state of lakes by monitoring 3 water quality parameters:
- Concentration of phytoplankton biomass measured as chlorophyll-a (chl-a) – Phytoplankton are photosynthetic microscopic organisms such as cyanobacteria and algae that live in lakes and oceans. They require nutrients to grow. Under ideal conditions, phytoplankton can rapidly grow into highly productive algal blooms, which can cover the surface of water bodies for several weeks.
- Concentration of growth-limiting nutrients such as total phosphorus (TP) – Phosphorus is an essential plant nutrient contributing to a lake’s productivity.
- Transparency of water expressed as Secchi depth – This is the water depth, at which a ‘Secchi’ disk (usually a black and white patterned disk) is no longer visible through the water. In most lakes, the density of algae in the water column typically determines offshore water transparency. As such, the deeper the Secchi depth (higher transparency value), the lower the biological productivity and the better the water clarity will be.
In most freshwater lakes, chl-a levels (phytoplankton biomass) are closely linked to the concentration of phosphorus (see Figure 1). For example, high phosphorus levels can lead to algal blooms and can result in reduced oxygen and poor water quality. Similarly, Secchi depth can be closely related to chl-a and TP levels.
In Alberta, many lakes contain naturally high concentrations of phosphorus stemming from nutrient-rich underlying sedimentary bedrock, soils and thick glacial deposits. However, phosphorus may also come from urbanization, industry and agriculture.
This indicator reports on total phosphorus (TP) and chlorophyll-a (chl-a) concentrations and Secchi depth transparency across 291 Alberta lakes and reservoirs sampled from 1980 to 2019 through a variety of Alberta government and Alberta Lake Management Society (ALMS) lake monitoring programs. Since these programs focus on recreational lakes and reservoirs mostly across the populated and road-accessible regions of Alberta, the set of 291 waterbodies does not represent a random sample of lakes and reservoirs across all provincial eco-regions; and as such, the proportions of lakes in different trophic classifications might differ when considering all lakes and reservoirs in the province.
Historically, water quality monitoring occurred on an infrequent, rotational basis for most lakes and reservoirs in Alberta. At present, there are insufficient data across years to reliably report on trends in trophic status at the provincial scale. However, long-term data required to report on trends are available for a small subset of highly utilized Alberta lakes. An AEP study of 38 lake basins with sufficient long-term data found TP or chl-a increased in 29% of the lakes, decreased in 16% and had no significant trend in just over half (55%) the lakes (Casey, 2011). As additional data become available, trend reporting will be included on the web page.
Understanding trophic status classification
Lakes can be classified based on their productivity levels across a gradient from low (oligotrophic) to moderate (mesotrophic), high (eutrophic), and very high (hypereutrophic). Trophic classifications of lakes can reflect a number of factors, including natural geology, human disturbance in watersheds, or the water quality of headwaters.
- Oligotrophic lakes contain low levels of phosphorus and usually support limited biological production (that is, low algal biomass) and thus low concentrations of chl-a. These lakes tend to have clear water and plenty of oxygen throughout the year to support fish and other aquatic organisms.
- Mesotrophic lakes have moderate levels of phosphorus and support greater biological production and chl-a. These lakes have moderate water clarity.
- Eutrophic lakes have even greater concentrations of phosphorus and chl-a. They tend to experience greater aquatic plant (also called macrophytes) and algae growth. Surface accumulations or ‘blooms’ of algae may occur during the warmest months. Water transparency in eutrophic lakes can be significantly reduced. Contact recreational activities such as swimming or water skiing may be discouraged. As well, oxygen depletion in deep waters may occur throughout the year due to excessive microbial decomposition of plant and algae.
- Hypereutrophic lakes have concentrations of phosphorus and chl-a beyond even that of eutrophic lakes. Algal blooms are common in these lakes and often intense and persistent throughout the summer and well into autumn. Oxygen depletion throughout the year may extend to the surface, resulting in fish kills. Water quality in hypereutrophic lakes can be impaired to the point where contact recreational activities may not be advisable.
Results
Based on total phosphorus (TP) and chlorophyll-a (chl-a), over half (54% and 57%, respectively) of the sampled lakes and reservoirs in Alberta are productive and classified as eutrophic or hypereutrophic. Based on Secchi depth, the percentage of lakes and reservoirs classified as eutrophic or hypereutrophic increases to 78%.
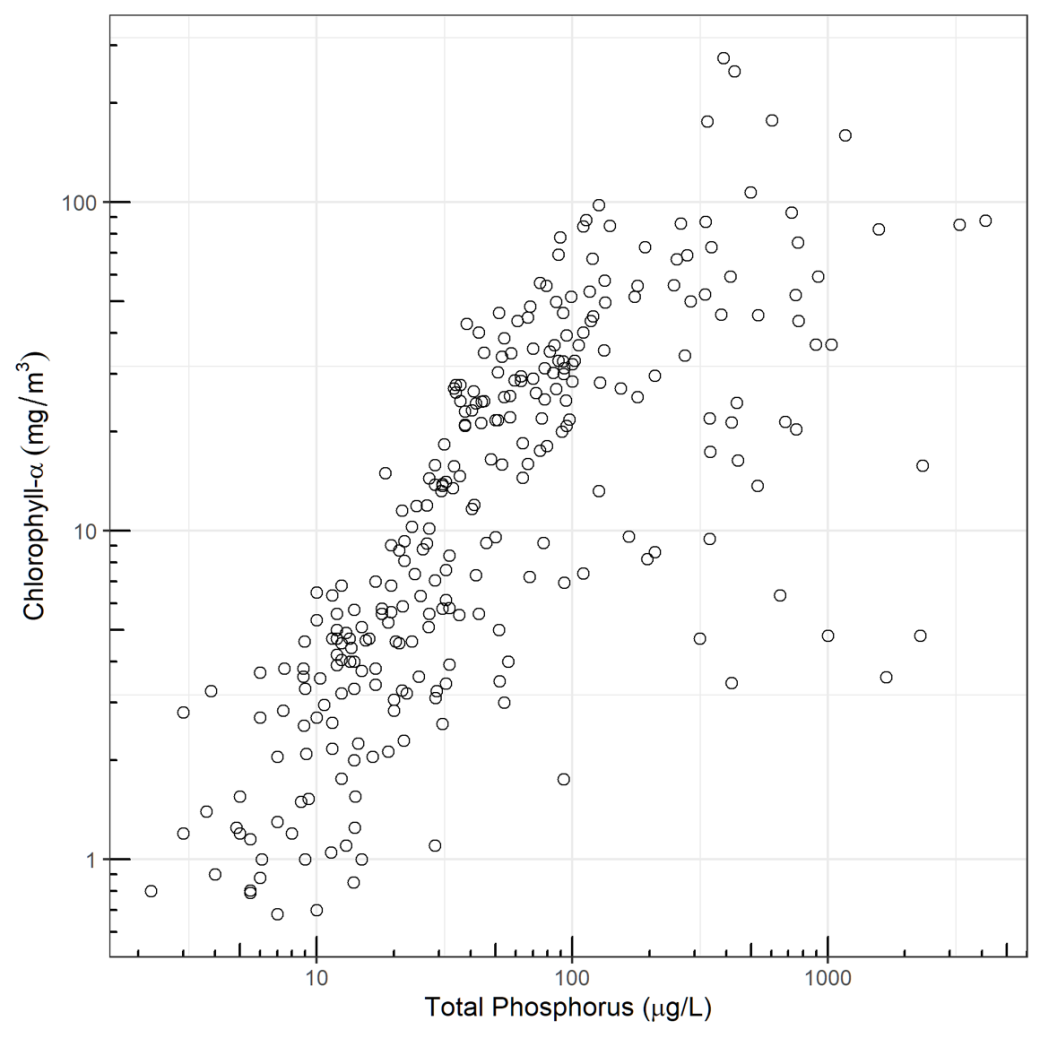
Figure 1. Scatterplot of average chlorophyll-a (chl-a) concentration (y-axis) vs. average total phosphorus (TP) concentration (a-axis) from Alberta Lakes surveyed from 1980 to 2019. Axes are log-scaled to linearize the relationship.
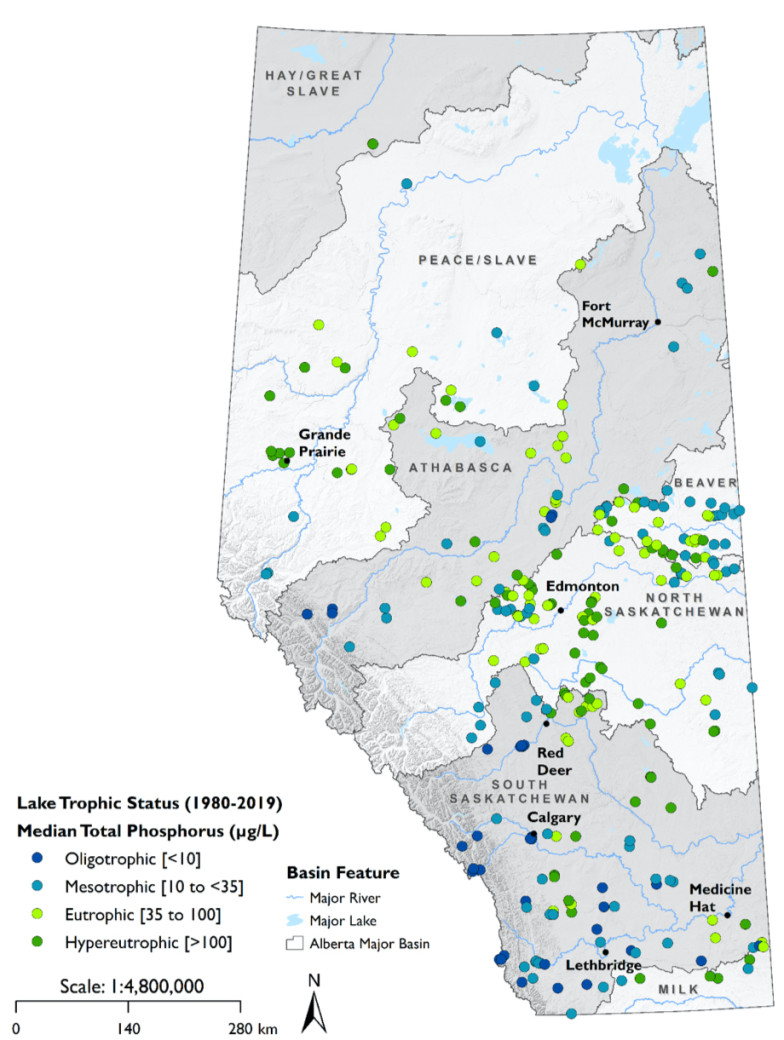
Figure 2. Lake trophic status based on median total phosphorus concentration across Alberta lakes between 1980 and 2019.
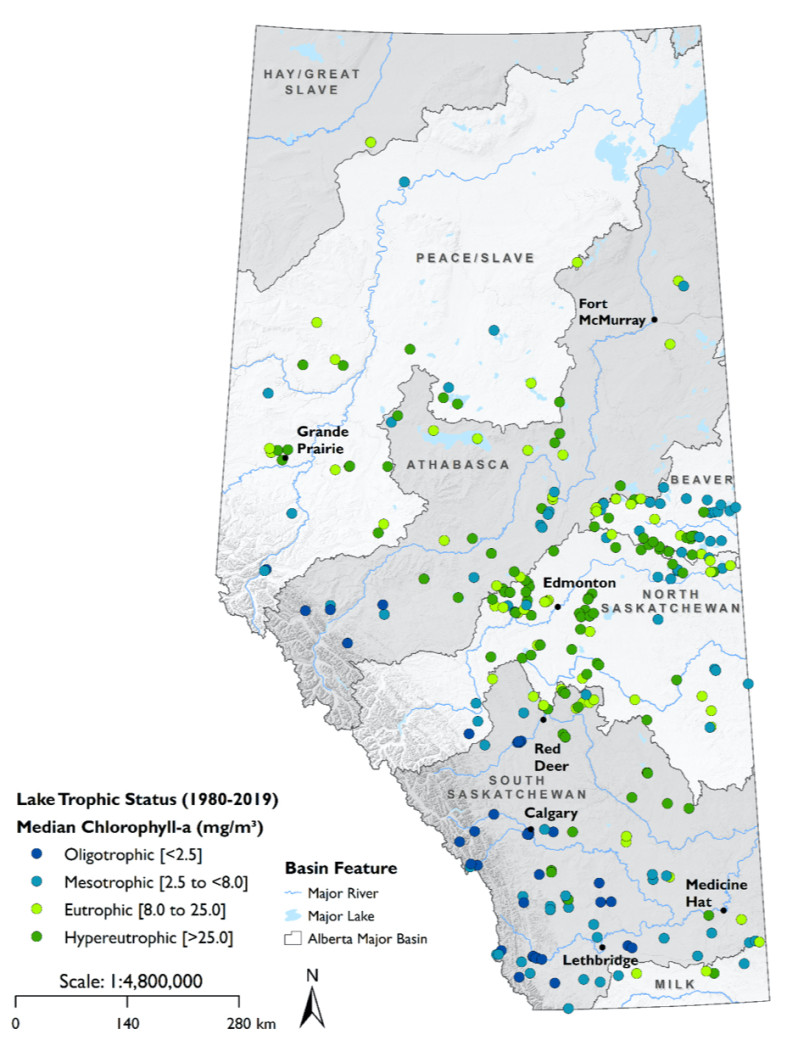
Figure 3. Lake trophic status based on median chlorophyll-a concentration across Alberta lakes between 1980 and 2019.
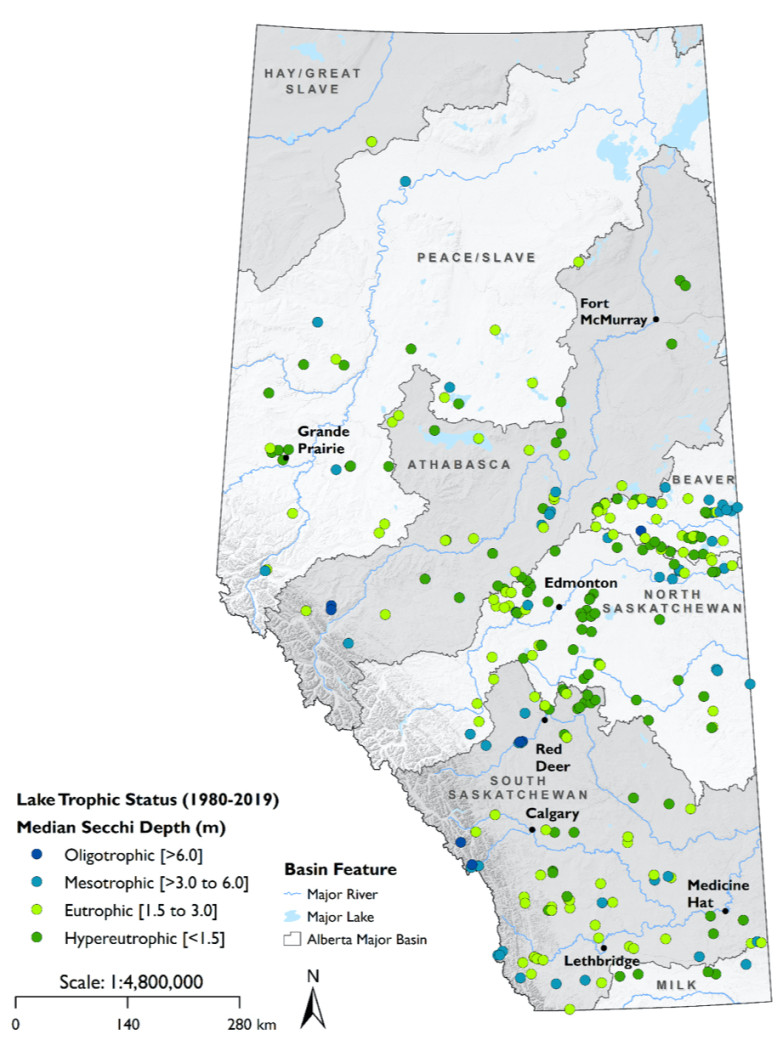
Figure 4. Lake trophic status based on median Secchi depth across Alberta lakes between 1980 and 2019
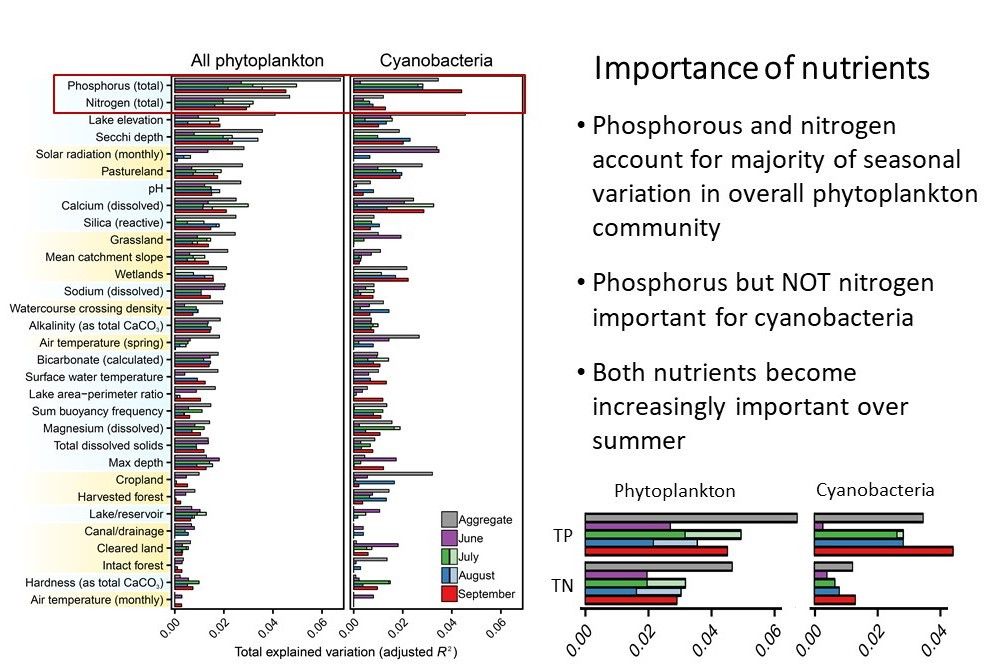
Figure 5. Importance of local ‘in-lake’ (in blue) and regional (in pink) environmental factors (vertical axis) explaining variation (horizontal axis) in monthly and seasonally aggregated phytoplankton and cyanobacteria community composition in 75 lakes and reservoirs across Alberta. Total explained variation is divided into spatially dependent (lighter bars) and spatially independent (darker bars) components for July and August (July only for cyanobacteria).
Focused study
Scientists, water managers and lake watershed stewardship groups have long-questioned if regional (for example, climate and land-use factors) and local environmental conditions (for example, lake basin depth, TP, water temperature) differ spatially in lakes across Alberta. They also question whether those differences can be used to classify lake water quality. In other words, can factors related to a lake’s location be used to predict water quality and specifically algal productivity (or trophic status)?
A recent study by AEP (Loewen et al. 2020) investigated the relative importance of co-occurring local (in blue) and regional (in pink) environmental factors (including TP and Secchi) explaining variation in planktonic algae and cyanobacteria communities in 75 lakes and reservoirs across Alberta (Figure 5). The study results showed that planktonic algae communities have relatively little variation across the province and that associations with environmental factors were largely independent of location. Lake basin elevation and nutrients (including phosphorus and nitrogen) were the few factors displaying spatial dependence and, even then, it was evident only in July and August data. This finding speaks to: (1) the primary importance of phosphorus (for planktonic algae and cyanobacteria) and nitrogen (for planktonic algae only) nutrients and (2) the fact that lakes in the foothills and montane regions of Alberta differ compared to the rest of the province.
Data collection and analysis
Water quality data was collected through AEP’s Provincial Lentic (lake) Monitoring Program and the Alberta Lake Management Society’s LakeWatch Program.
Of the 291 lakes and reservoirs, 288 had TP data, 284 lakes had chl-a data and 273 lakes had Secchi depth measurements. Values below method detection limits (MDL) were replaced with a value of ½ MDL for calculation purposes. To provide as current of a snapshot of lake trophic status as possible based on available datasets, only the three most recent years of data prior to and including the last sampled year for each lake were included in the calculation of median TP, chl-a or Secchi depth values. Trophic status was assigned for each parameter based on the Organisation for Economic Co-Operation and Development’s trophic classification system (OECD 1982). All analyses and generation of supporting figures were performed in R 4.0.0 (R Core Team 2020). Maps (Figs. 2-4) were produced in ArcGIS Desktop 10.7.1.
Note that while the 3 trophic indicators are often closely related, they do not always show a relationship. As Secchi depths are determined from light penetration and water turbidity, the measured depths are not only affected by algal growth but also other factors including silt and fine particulates from erosion (e.g., glacial flour) or dissolved organic matter. Thus, shallow Secchi depth measurements can occur in low productivity lakes when turbidity is influenced strongly by these other factors.
Water monitoring
Access data and learn about how Alberta’s Environmental Science Program monitors Alberta’s water quality and quantity: Environmental monitoring.