Call 310-FIRE (3473) to report a wildfire in a forested area.
Overview
Forecast products are created by Alberta Wildfire meteorologists to inform wildfire personnel, fire managers and other stakeholders in the Forest Protection Area of Alberta. Products are generated during the wildfire season, from March 1 to October 31, once snow has melted.
Forecast products
-
AM and PM weather forecasts
The AM and PM weather forecasts are written descriptions of forecasted weather conditions that may impact wildfire management.
-
Today and tomorrow's forecast maps
Forecast maps display the maximum temperatures, minimum relative humidity and sustained wind patterns, as well as upper and surface weather systems. Today’s map displays conditions expected at 6 pm on the issuing day and tomorrow’s map displays conditions expected at 6 pm on the following day. AM forecast issued at 10:00 am each day, PM Forecast map issued at 3:00 pm each day.
Today

Tomorrow

-
AM and PM analyzed surface maps
The analyzed surface maps display the temperature, dewpoint, wind, precipitation, clouds, smoke and surface weather systems. The AM map displays conditions at 6 am and the PM map displays conditions at noon on the issuing day. AM analyzed map issued at 9:00 am each day, PM analyzed map issued at 2:00 pm each day.
AM
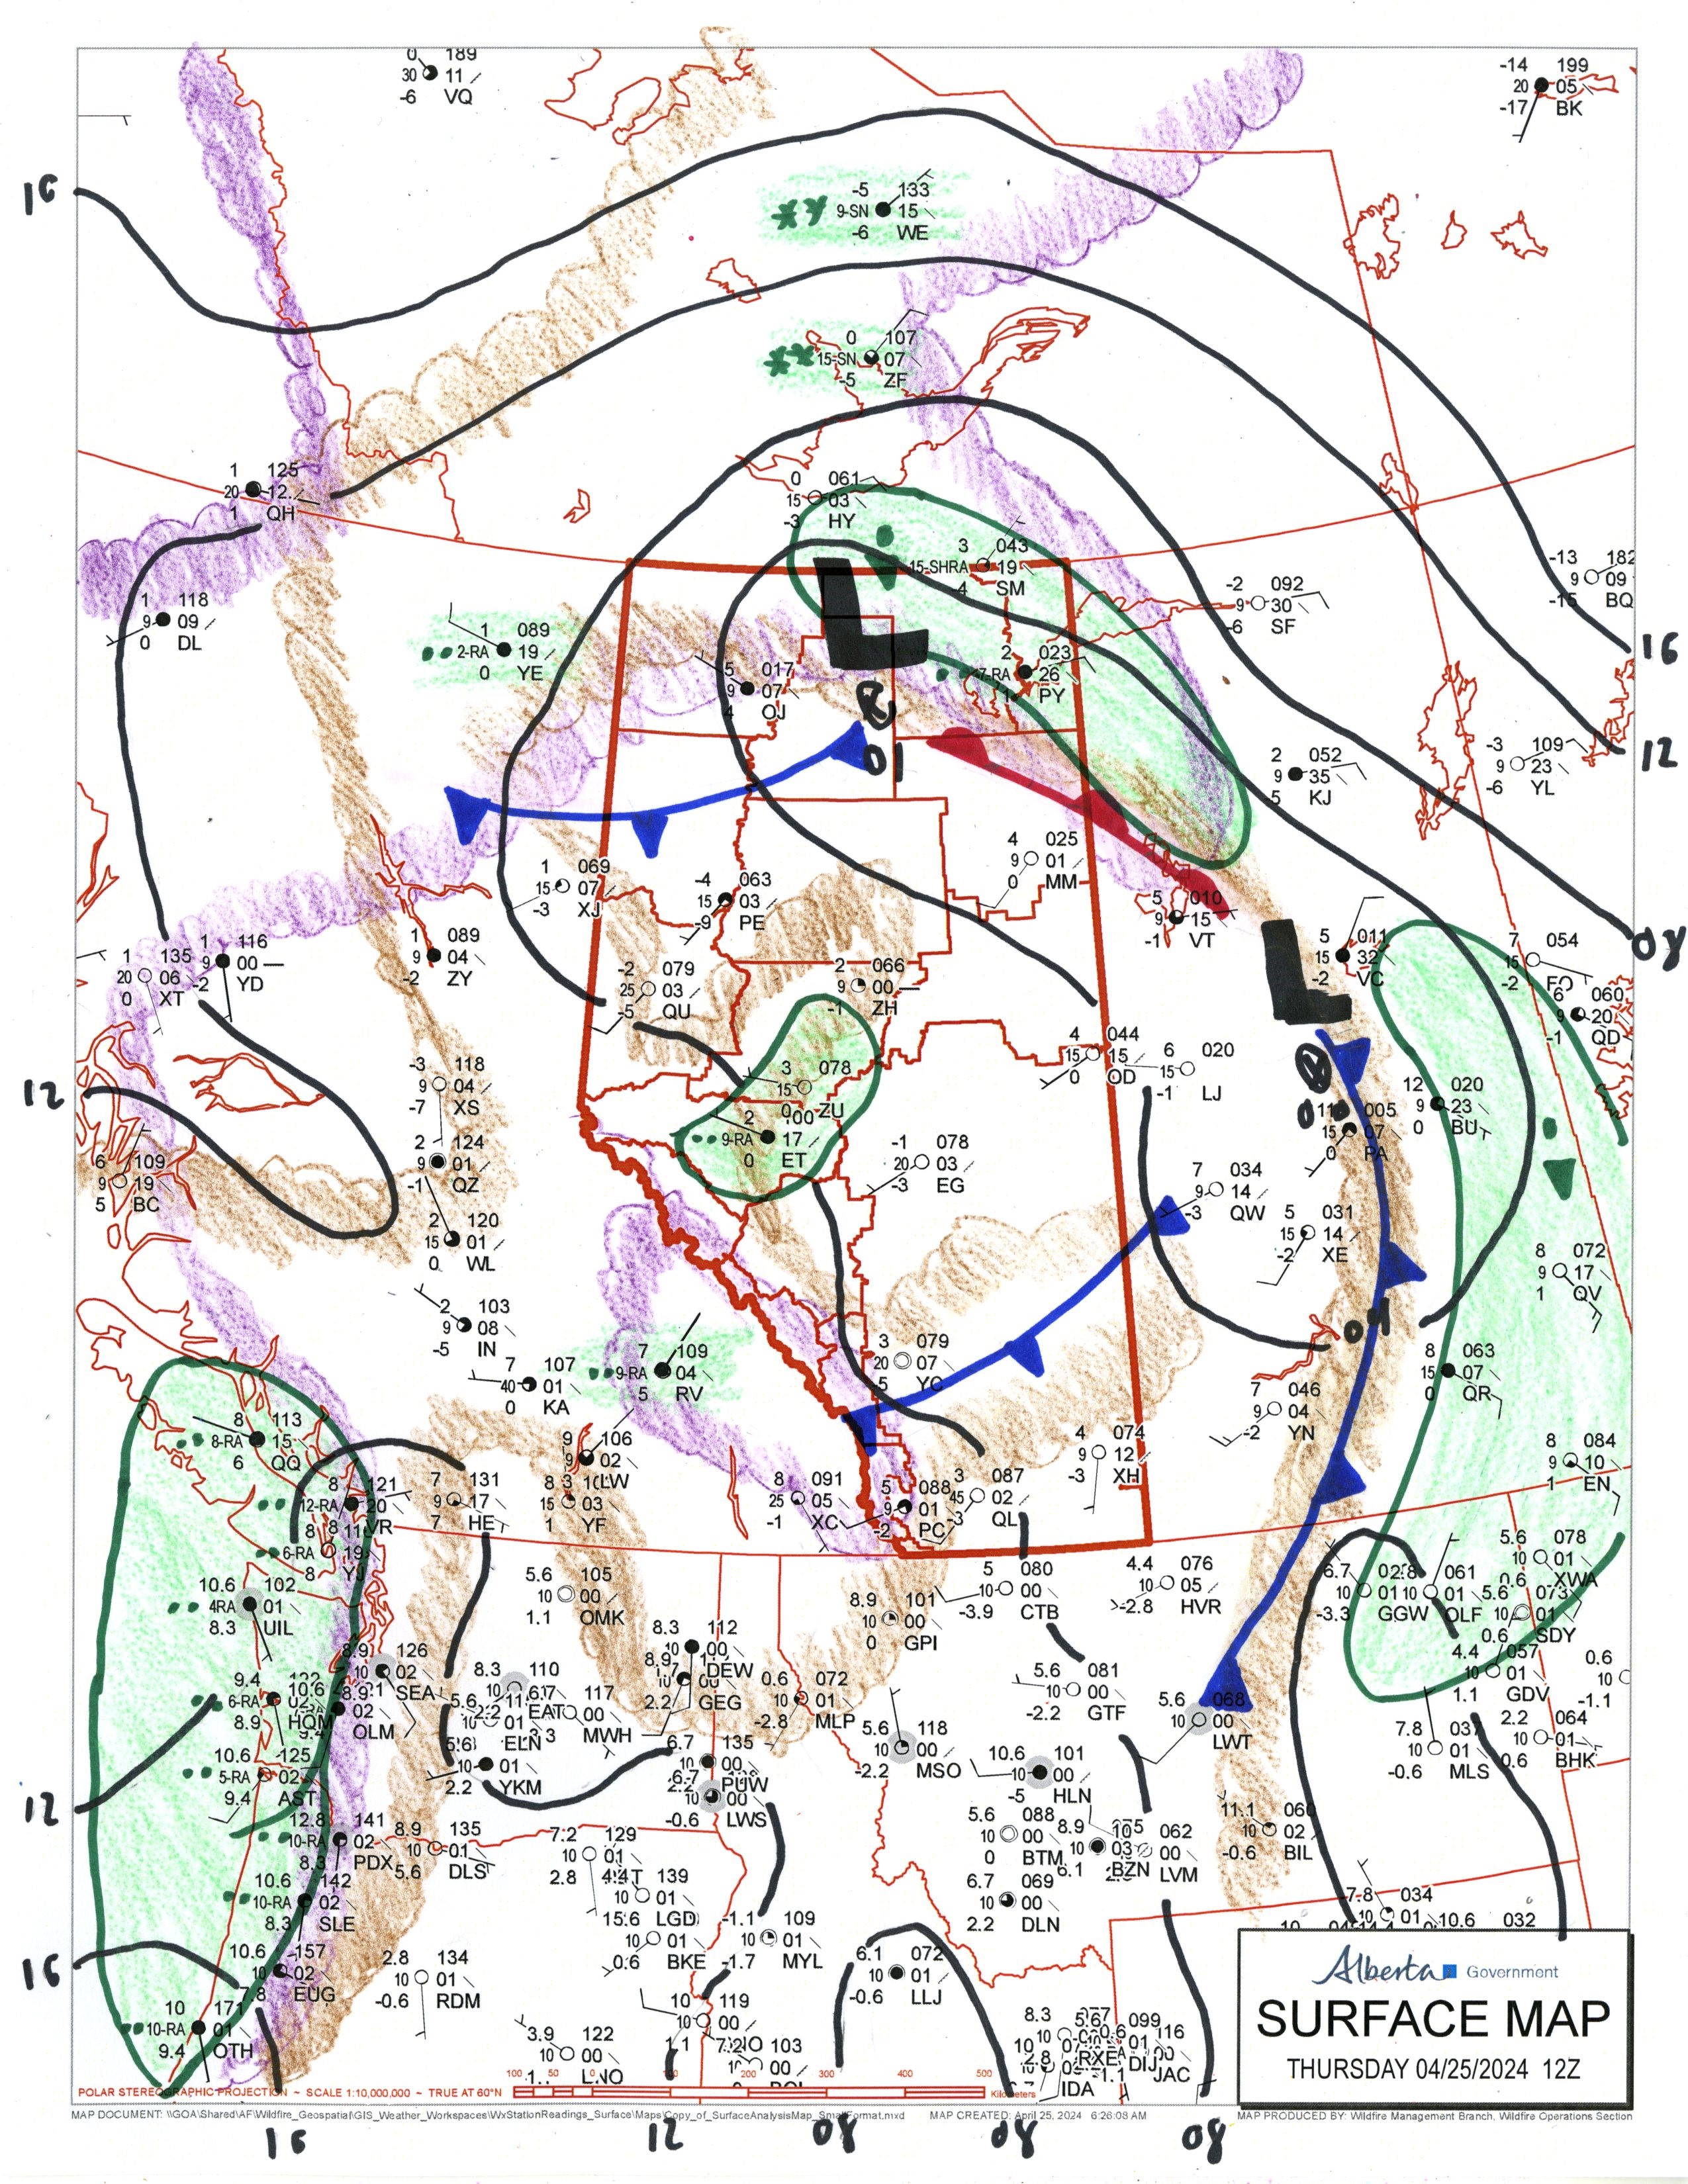
PM

-
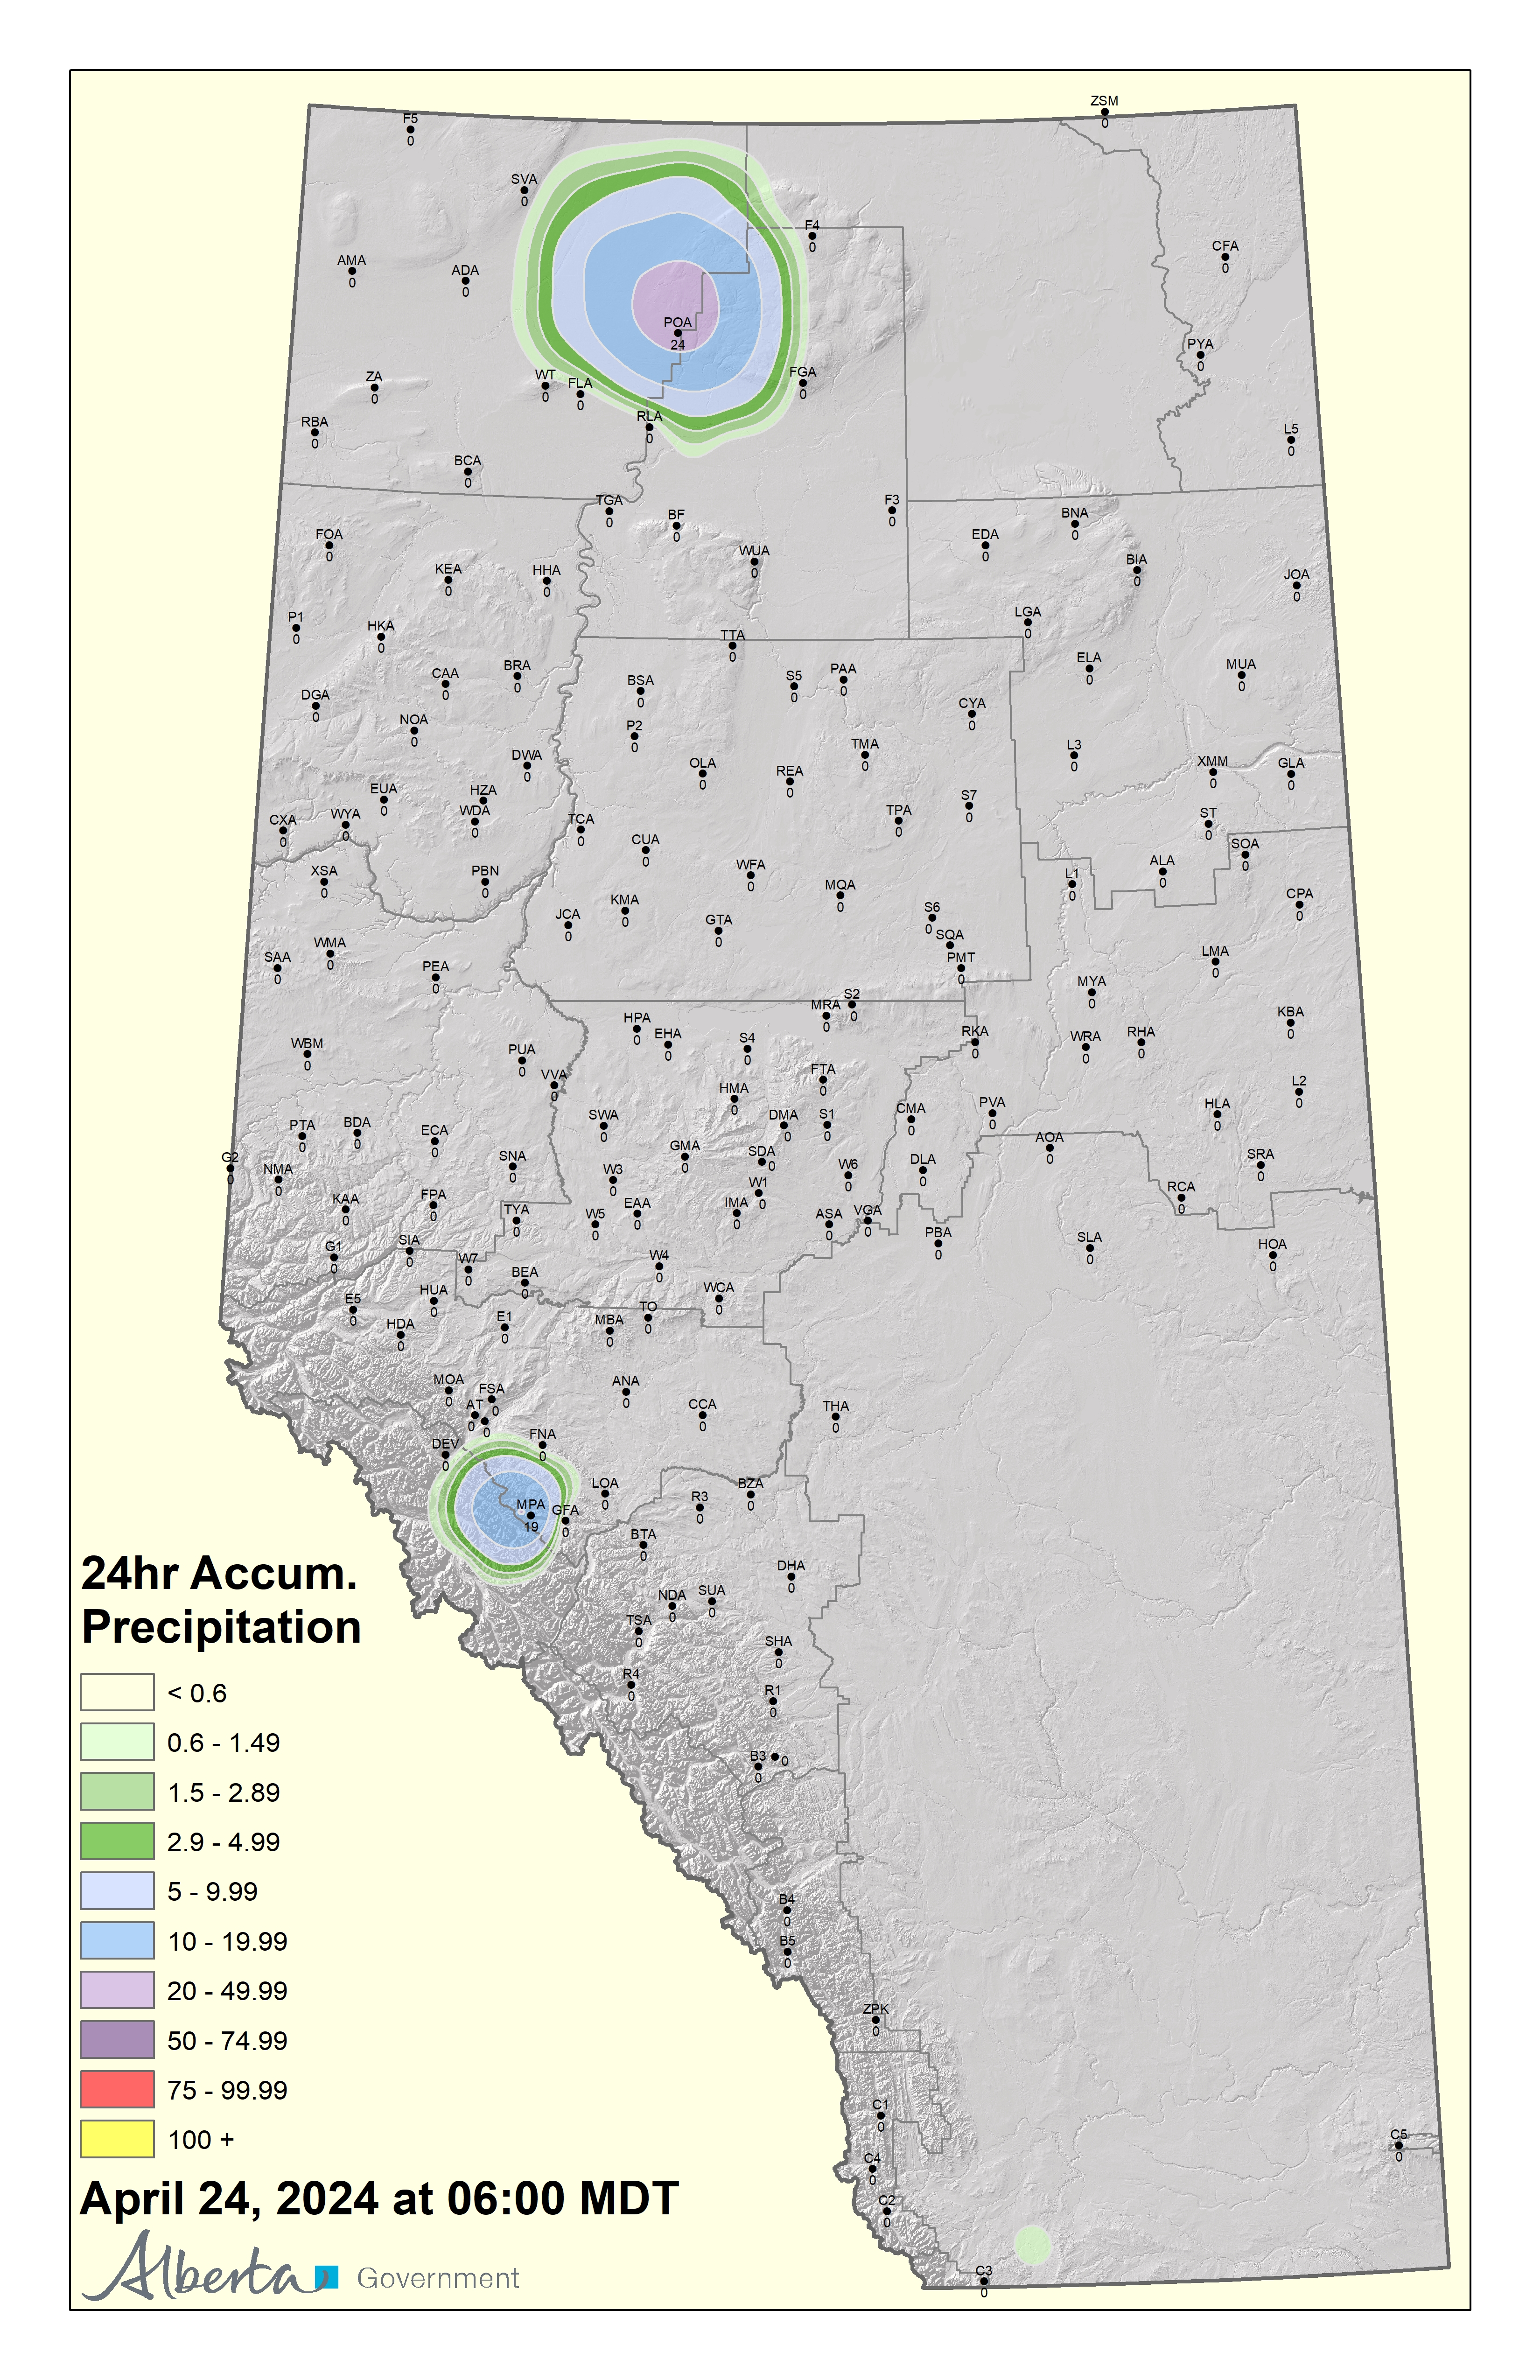
Daily precipitation map
The daily precipitation map provides a visual representation of the precipitation received in the Forest Protection Area of Alberta in the last 24 hours.
-
Weekly precipitation map
The weekly precipitation map provides a visual representation of the precipitation received in the Forest Protection Area of Alberta in the last 7 days. This map may also be generated after a significant storm.

-
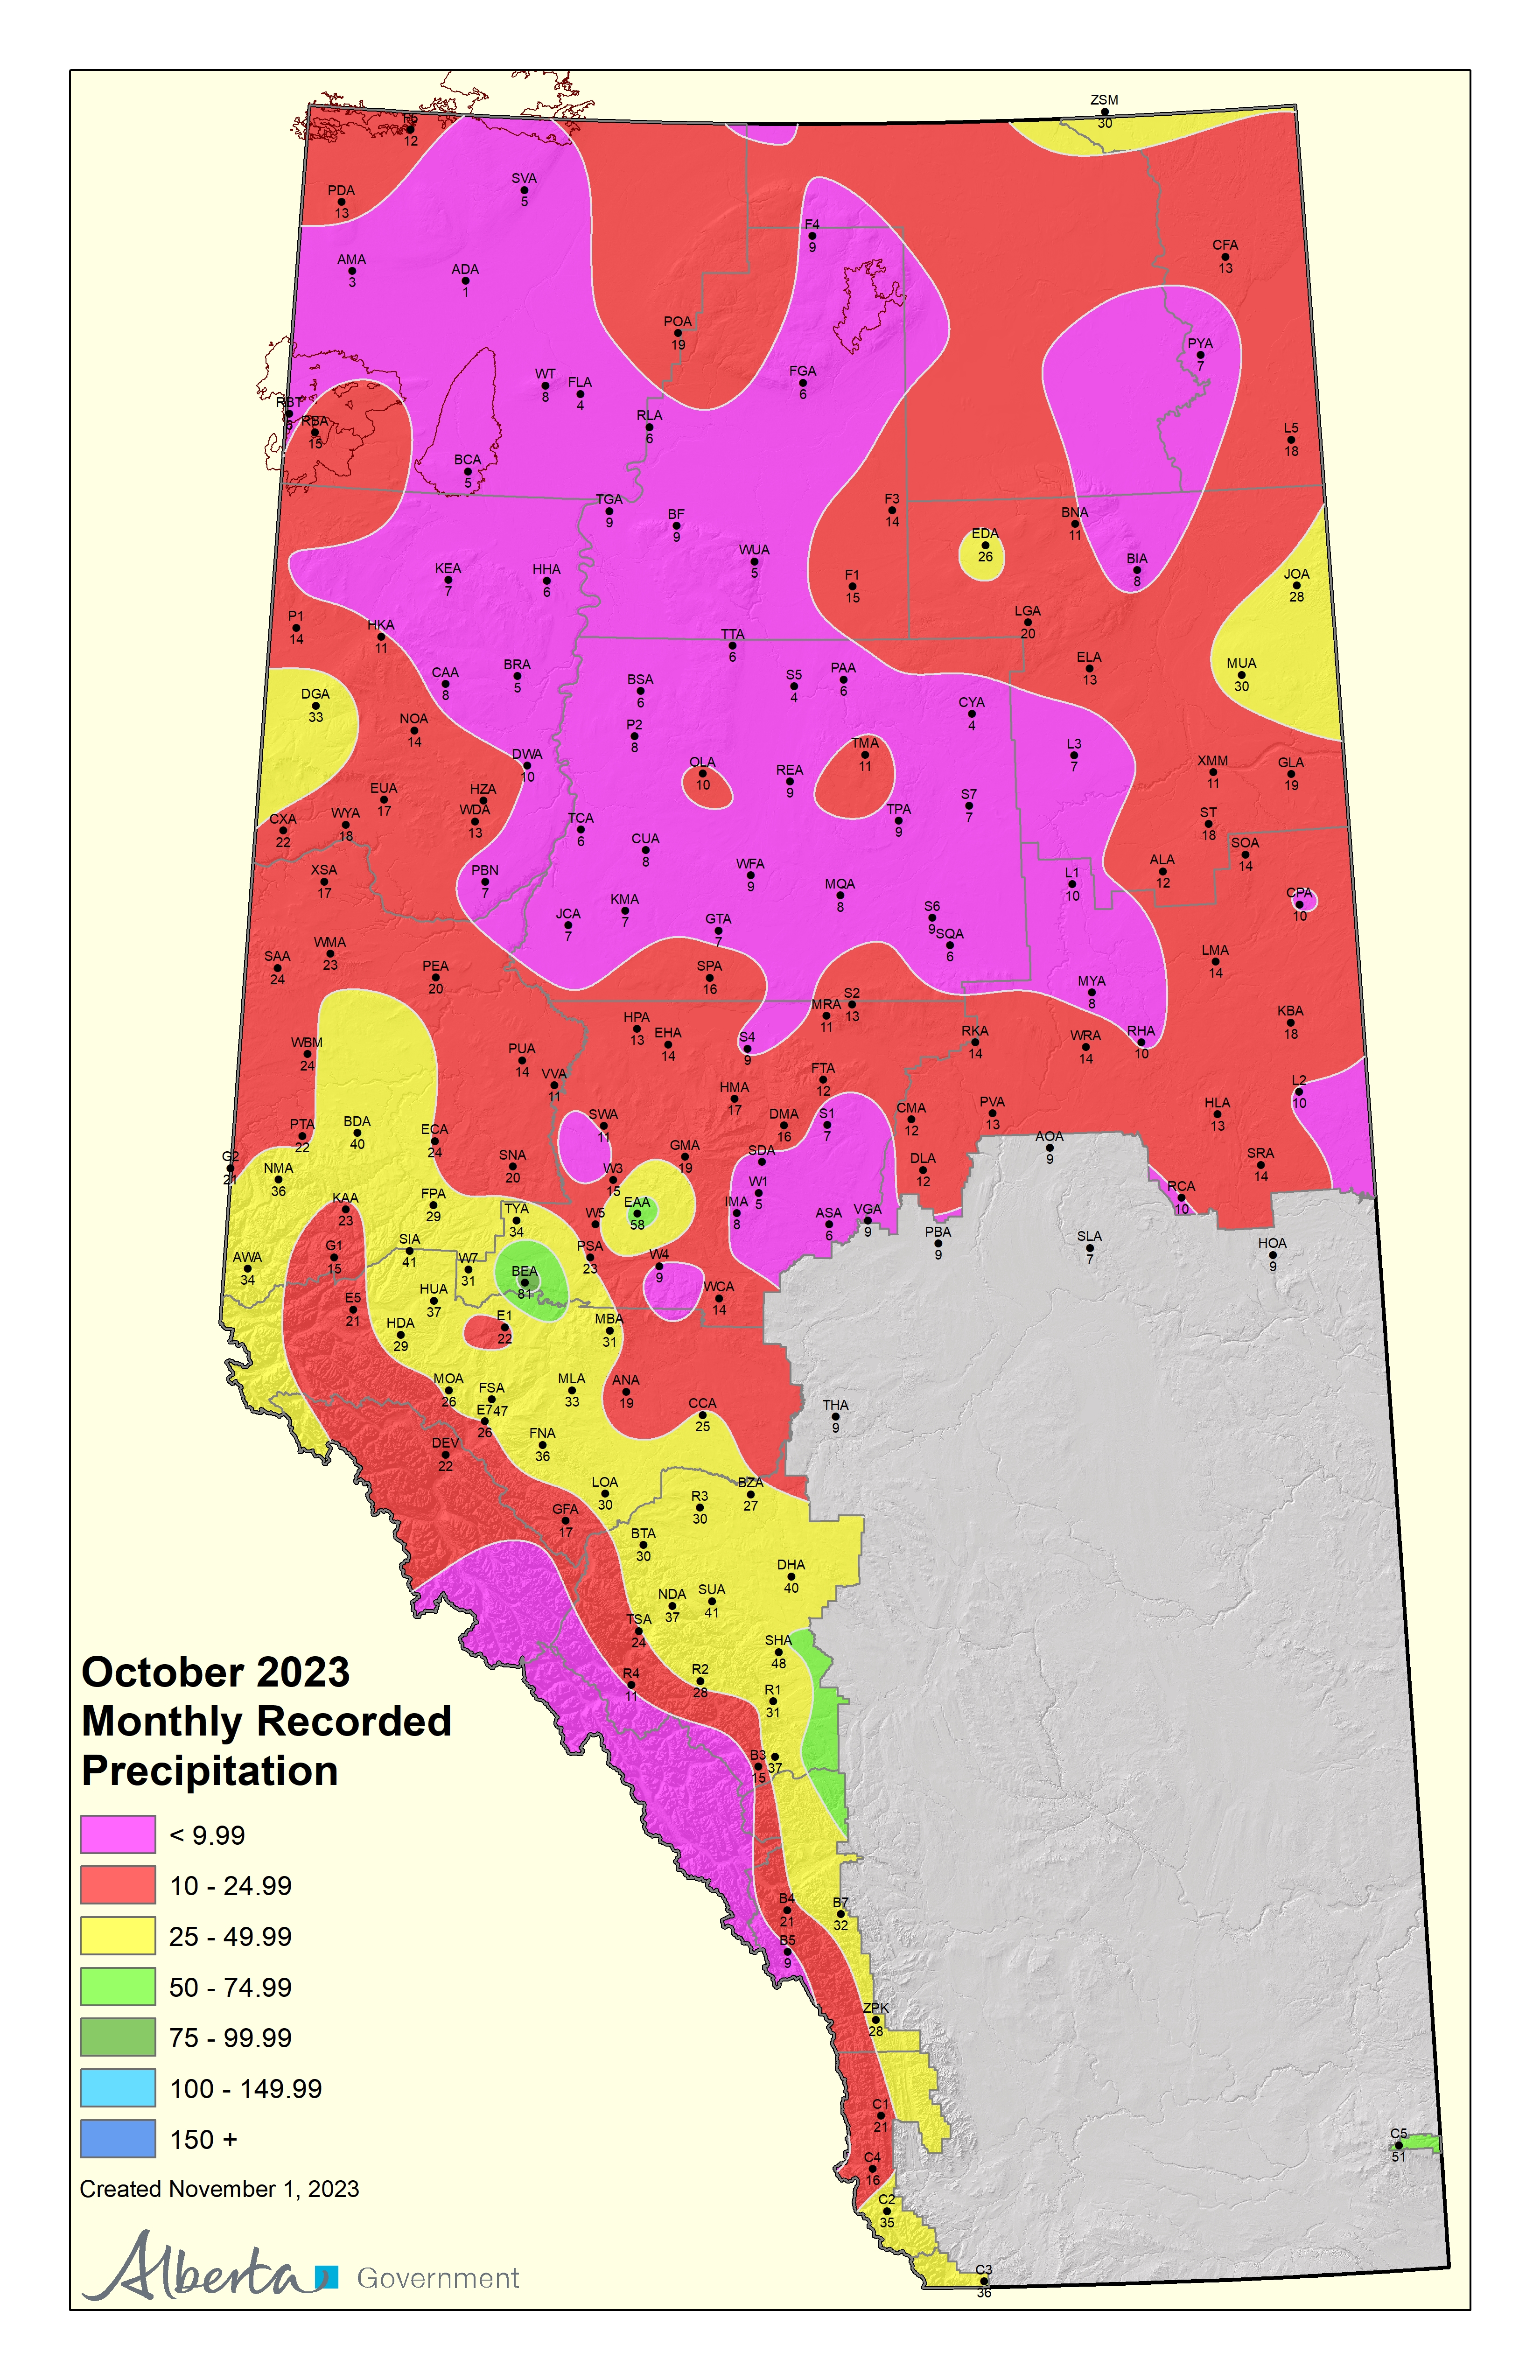
Monthly precipitation map
The monthly precipitation map provides a visual representation of the precipitation received in the Forest Protection Area of Alberta in the last month.
-
Weather pattern outlook for days 2 to 5
In the weather pattern outlook, the upper maps project the heights in decameter (represented by black solid lines) and isotherms in °C (represented by red dash lines), as well as ridging and troughing patterns expected at 6 am, for 2 to 5 days from the issuing day. Surface maps project the pressure patterns with low and high systems for 6 pm and 12 hour precipitation accumulation (in millimetre) ending by midnight of day 2-5 from the issuing day. These products are updated daily at 09:00 am.
Day 2 upper

Day 2 surface

Day 3 upper

Day 3 surface

Day 4 upper

Day 4 surface

Day 5 upper

Day 5 surface

-
Vertical wind profile
Vertical wind profile displays the observed wind speed (in knot (one nautical mile per hour)) changes with altitude (in kilometre above ground level) at a weather station. This product is issued at 9:00 am each day or when available.

Data
- AM weather data (PDF)
- AM weather data (CSV)
- PM weather data (PDF)
- PM weather data (CSV)
- Weather Report Format (PDF) (terminology and definitions)
Weather data has been collected daily in Alberta since the late 1960s in some locations.
Contact Alberta Wildfire’s weather section at [email protected] to obtain historical weather data.
Lightning
Alberta Wildfire operates a lightning detection system developed by VAISALA. The system enables fire managers to monitor cloud-to-ground lightning activity on a provincial basis.
Weather stations
The Forestry Division operates a network of close to 200 weather stations to monitor fire danger in Alberta’s forests.
Red Flag Warning or Watch
The Red Flag Watch is intended to provide situational awareness for wildfire personnel and the public that a hazardous fire environment is developing.
Annual fire weather reports
Each annual report summarizes the fire season from a synoptic weather perspective, highlighting the weather conditions that lead up to extreme fire danger.
Contact
For questions about weather data, forecasts and observations:
Email: [email protected]
Information line: 1-866-394-3473 (FYI-FIRE)
Media inquiries: 780-420-1968
Email: [email protected]
Download the Alberta Wildfire app