Government mail service may be affected by the Canada Post labour disruption. Learn about how critical government mail will be handled.
About the indicator
Freshwater lakes and rivers naturally contain low concentrations of dissolved salts including chloride. Chloride is an essential ion that plants and animals require in small amounts for normal cell function. Chloride can originate from various sources, both natural (such as mineral deposits) and human (such as deicing salts, wastewater treatment, and agricultural inputs). When chloride contaminates freshwater ecosystems such as lakes and rivers, the process is called salinization.
The salinization of freshwater environments presents a threat to water resources. As freshwater salinity increases, so does the potential contamination of groundwater and surface water resources. Elevated salinity in Alberta’s rivers and streams may also degrade transportation (for example, bridges) and water supply infrastructure, potentially resulting in economic, environmental and social consequences.
There are 2 main types of salinization that typically occur in freshwater environments:
- Primary salinization – driven by a variety of natural processes (such as rock weathering, mineral salt deposits and atmospheric deposition)
- Secondary salinization – driven by societal factors such as deicing salts applied to roads, wastewater treatment and industrial effluent, agricultural inputs, irrigation and land clearing.
Chloride (Cl-) is regularly analyzed in water quality monitoring and research programs to help inform the stewardship of water resources. The Canadian Council of Ministers of the Environment (CCME) developed chronic (120 mg/L) and acute (640 mg/L) surface water guidelines for Cl-, above which there are elevated risks to aquatic life. CCME water quality guidelines for the protection of agricultural water uses, such as irrigation and livestock water, also provide crop specific guidelines for Cl-, ranging from 100-960 mg/L.
Data collection and analysis
Cl- data was obtained from 2 of Alberta's river monitoring programs: the Long-Term River Network (LTRN) and the Tributary Monitoring Network (TMN). The LTRN program monitors major rivers whereas the TMN program typically monitors smaller tributaries. Although an expansion of the TMN program into the North Saskatchewan River started in 2019, there was insufficient data to include these tributary sites in this analysis.
To understand spatial variability across the province, the concentration of Cl- from 2016 to 2019 was compared across all sites. To investigate the potential impact of Cl- on aquatic biota and irrigation, Cl- concentrations were compared to the Canadian Council of Ministers of the Environment (CCME) guidelines for chronic, acute and crop-specific surface water. To understand potential changes in Cl- over time, sites with more than 10 years of monthly monitoring data were further analyzed for temporal trends.
For more detailed information on the methods used, consult the report on Chloride in Surface Waters of Alberta’s Rivers – Condition of the Environment Report 2021.
Results
-
Chloride concentrations in Alberta’s rivers
- For the 2016 to 2019 reporting period, upstream headwater monitoring sites often had lower Cl- concentrations that are frequently below analytical detection and thus cannot be precisely measured in water samples.
- Cl- concentrations typically increased from headwaters to downstream sites across the province, with the exception of the Bow and Battle Rivers. In the Bow River, Cl- concentrations increased towards their peak in the Calgary region and remained elevated thereafter. In the Battle River, Cl- concentrations decreased from the upstream site to downstream site (Figure 1 and Figure 2).
- Cl- concentrations were often higher in smaller tributaries relative to major rivers across Alberta (Figure 2 and Figure 3).
-
Comparison to guidelines
- Between January 2016 and December 2019, 5 of the 3,858 samples showed exceedances of the CCME protection of aquatic life (PAL) acute guideline. These include 2 exceedances in Nose Creek, 1 in Fish Creek in the Bow River watershed, and 1 each at Waskasoo Creek and Threehills Creek Site 2 in the Red Deer River watershed (Figure 4).
- In the same timeframe, there were 54 PAL chronic guideline exceedances, of which 29 occurred in Nose Creek, 9 in Fish Creek and 9 in Waskasoo Creek. Additionally, there were 79 irrigation guideline (i.e., 100 mg/L) exceedances, of which 37 occurred in Nose Creek, 11 in Fish Creek, 11 in Waskasoo Creek, 7 at the Battle River Site 1, and 6 in Pine Creek (Figure 4).
- The Nose Creek monitoring site in Calgary stands out as having the only median concentration above the PAL chronic guideline with a median Cl- of 145 mg/L (Figure 4). Additionally, 84% of the 44 samples taken from Nose Creek exceeded the irrigation guideline and 66% exceeded the PAL chronic guideline.
-
How chloride concentrations are changing in Alberta’s rivers
- In northern Alberta, Cl- concentrations were found to be decreasing over time at 2 of the 10 sites in the Athabasca and Peace Rivers. For all other sites in northern Alberta, the trends were not significant or there were too many Cl- samples below the limits of detection (for example, censored) to confidently assess temporal trends (Figure 5).
- In contrast, Cl- concentrations were found to be increasing at 14 of 19 sites monitored across central and southern Alberta. Sites on the Bow River near and downstream of Calgary had the largest annual per cent increases that were between 3 to 4% per year (Figure 5).
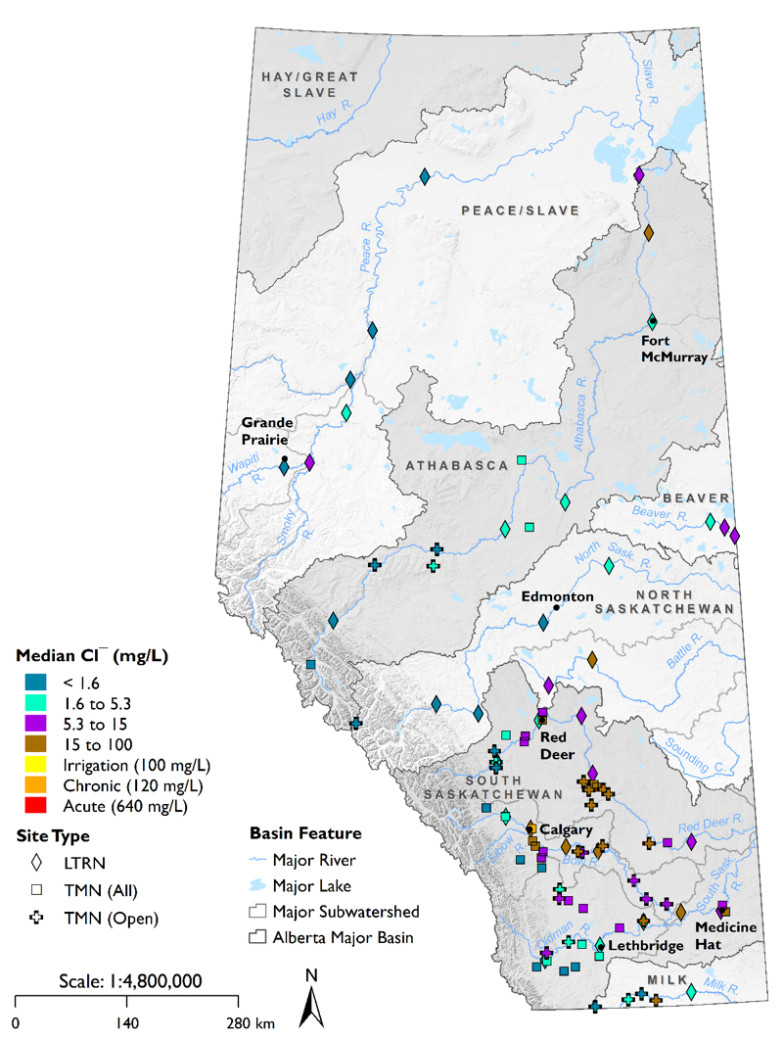
Figure 1. Map of the median Cl- concentrations at LTRN and TMN sites from 2016 to the end of 2019. TMN (All) indicates that samples were obtained generally throughout the year whereas TMN (Open) indicates that samples were predominantly obtained during the open water season. The percentile of each site’s median Cl- concentrations was used to group sites into bins based on the percentiles of all sites included in the analyses (that is, 0 to 25, 25 to 50, 50 to 75 and 75 to 100 percentiles). Additional bins were created to reflect irrigation (>100 mg/L), chronic (>120 mg/L) and acute (>640 mg/L) guideline exceedances.
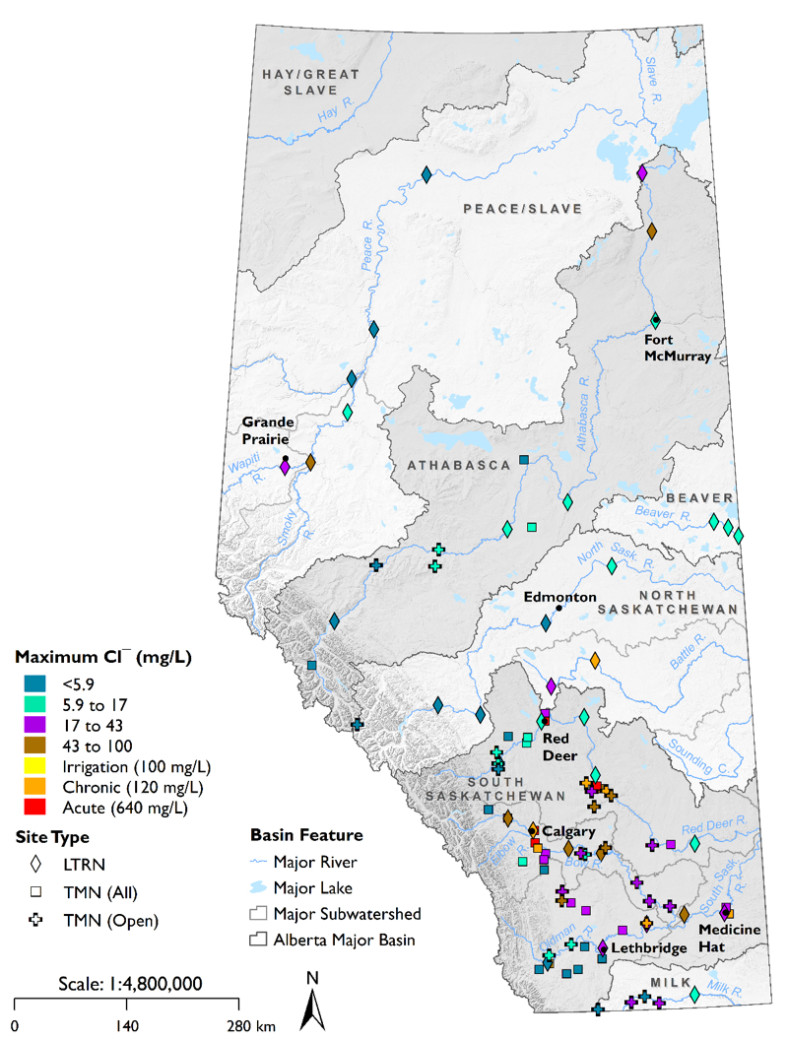
Figure 2. Map of the maximum Cl- concentrations at LTRN and TMN sites from 2016 to the end of 2019. TMN (All) indicates that samples were obtained generally throughout the year whereas TMN (Open) indicates that samples were predominantly obtained during the open water season. The percentile of each site’s maximum Cl- concentrations was used to group sites into bins based on the percentiles of all sites included in the analyses (that is, 0 to 25, 25 to 50, 50 to 75 and 75 to 100 percentiles). Additional bins were created to reflect irrigation (>100 mg/L), chronic (>120 mg/L) and acute (>640 mg/L) guideline exceedances.
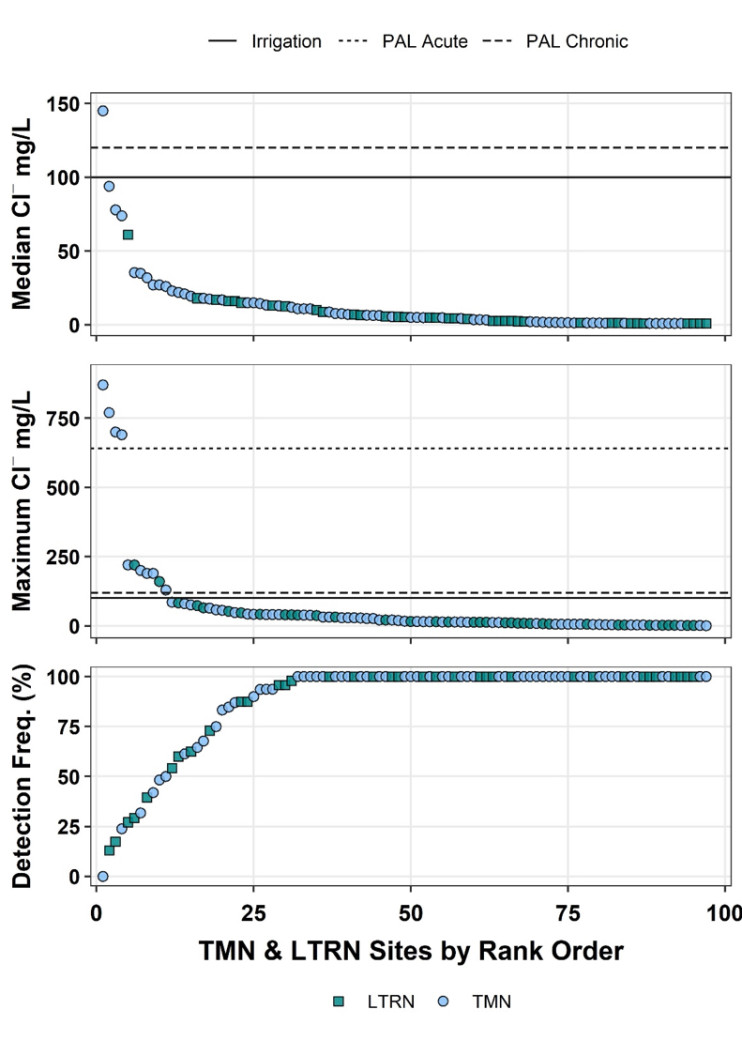
Figure 3. Plot of the rank order of median (top) and maximum (middle) Cl- concentrations along with their detection frequency at sites from January 2016 to December 2019.
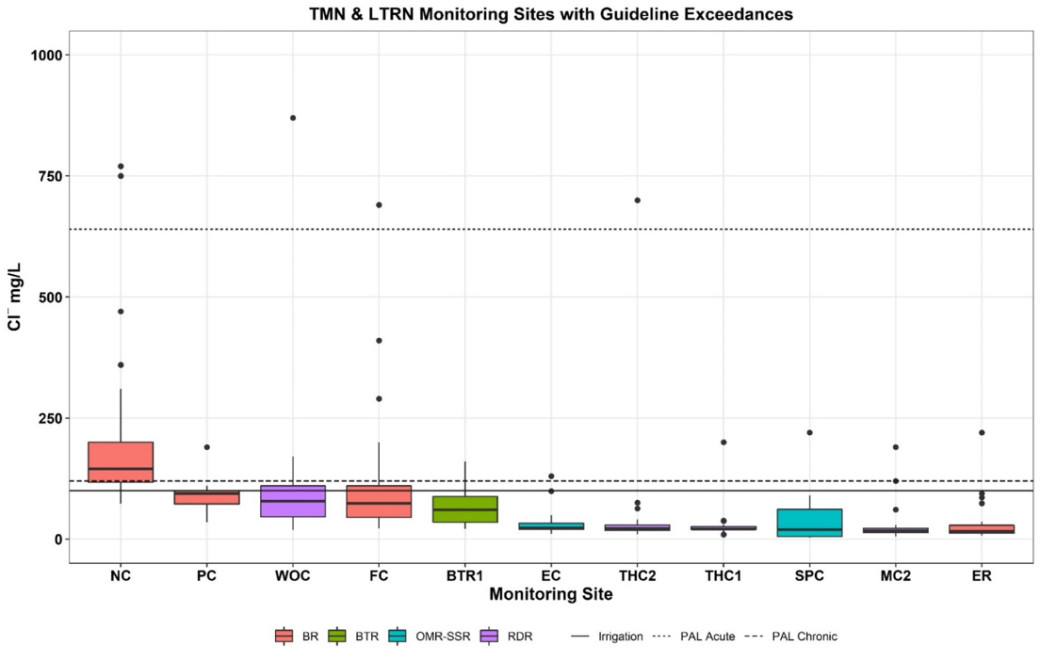
Figure 4. Box plot of TMN and LTRN monitoring sites that had a guideline exceedance between January 2016 and December 2019. Monitoring sites in this plot include Nose Creek (NC), Pine Creek (PC), Waskasoo Creek (WOC), Fish Creek (FC), Battle River (BTR) Site 1, Expanse Coulee (EC), Three Hills Creek (THC) Site 1 & 2, Seven Persons Creek (SPC), Michichi Creek (MC) and the Elbow River (ER). The line in the middle of the box depicts the median (for example, middle) of the dataset, the box edges represent the 25th and 75th percentiles and the area inside the box covers the interquartile range. The whiskers extend outward from the box to the highest or lowest value that is within 1.5 times the interquartile range. Data beyond the whiskers depict outliers, which are plotted as points on the box plots.
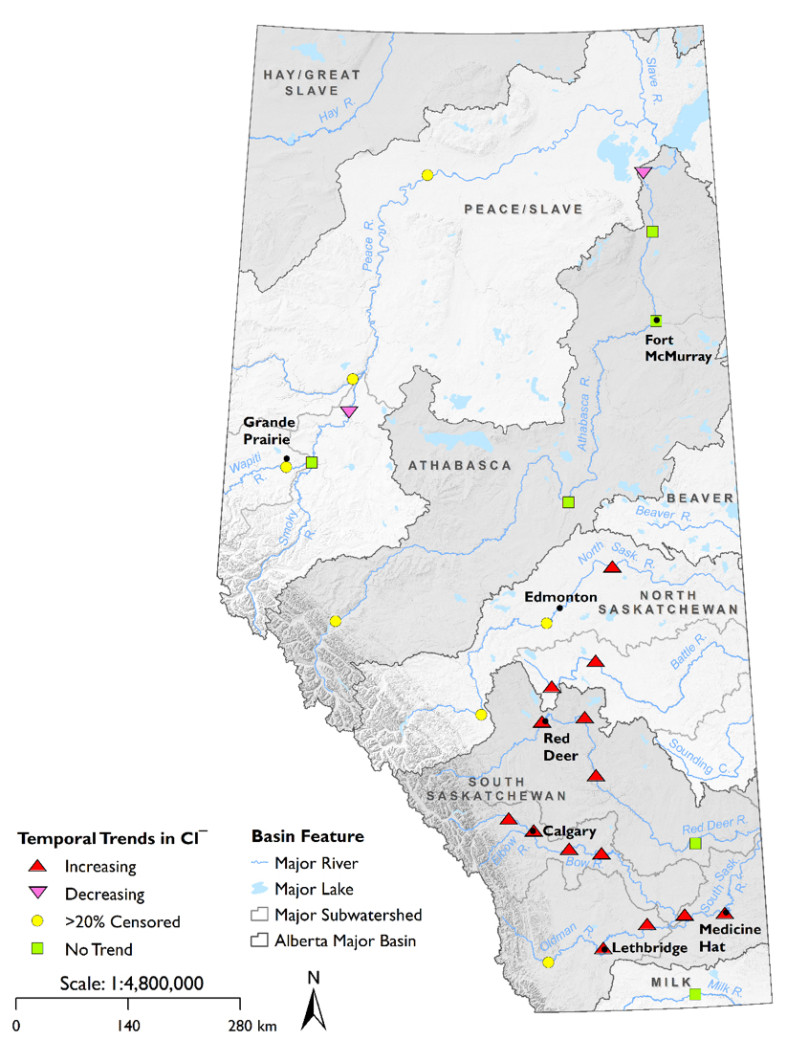
Figure 5. Results from the trend analyses for all annual samples highlighting locations in the province where Cl- was found to be increasing or decreasing over time along with sites without significant trends or where there was too much data below the limits of analytical detection (that is, censored data > 20%) to conduct the analysis. Trend analyses were only conducted for LTRN sites as TMN sites did not have sufficient years of data to conduct trend analysis.
Focused studies
South Saskatchewan River
A 2017 study by the Government of Alberta examined spatial and temporal trends in river salt concentration and composition in the South Saskatchewan River Basin (SSRB). Overall, a significant increase in the concentration of one or more major salts over time was observed at 12 monitoring stations with datasets suitable for temporal analysis. In particular, the rate of change was generally highest for chloride, with road salt and to a lesser extent municipal wastewater being identified as the major chloride sources (Figure 6). For most other salts, spatial variation was driven by the proportion of salt-affected soils and/or cropland. Salt concentrations for major rivers in the SSRB were below guideline values though their increasing trends highlight the potential risk of salinization in this semi-arid region.
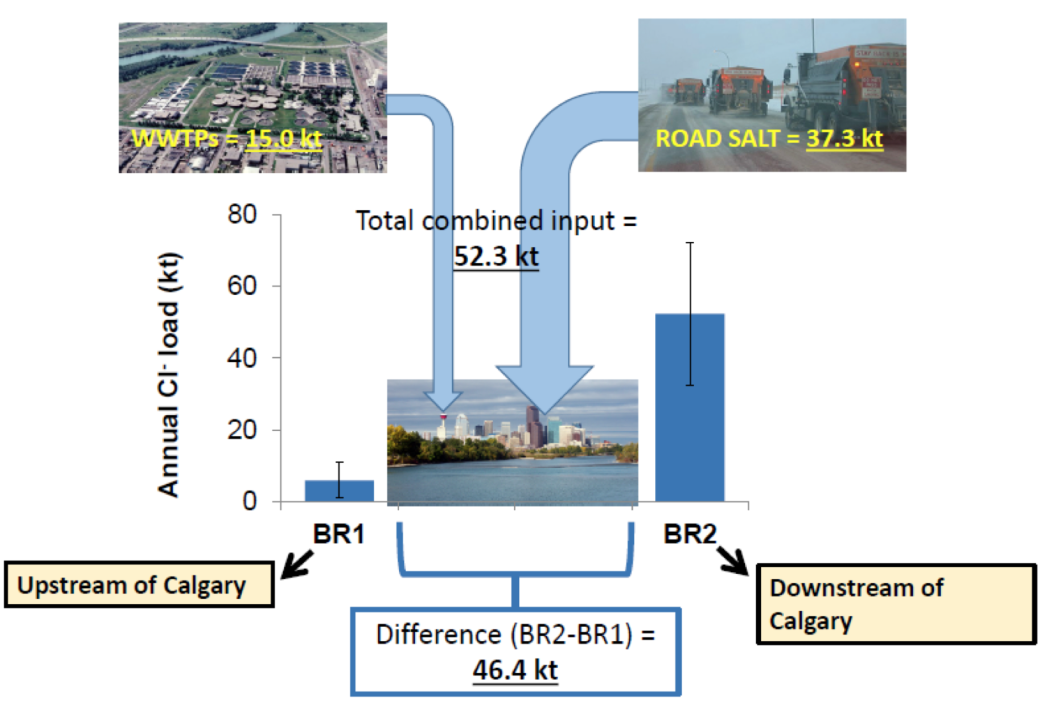
Figure 6. Comparison of mean (+/- 1 standard deviation) annual Cl- loads (2008 to 2014) upstream of Calgary near Cochrane (BR1) and downstream of Calgary below Carseland Dam (BR2) with mean annual Cl- loads from road salt application and municipal wastewater treatment plants (WWTPs) from the City of Calgary.
North Saskatchewan River
Another 2019 study by AEP investigated trends of various salts (that is, major ions) in river water sampled at long-term river network (LTRN) monitoring stations on the North Saskatchewan River (NSR). The study found that chloride, sodium and potassium increase as you move downstream in the NSR (Figure 7). Although there were no significant temporal trends for chloride, sodium and potassium upstream of Edmonton, these salts were found to be increasing significantly downstream of Edmonton. Road, commercial and private deicing salts (54%), agriculture (20%), and effluent (15%) were reported to be the main chloride sources to the watershed in the NSR between Devon and Pakan between 2010 and 2017 (Figure 7). Although chloride levels are well below guideline values in the NSR, there is evidence of freshwater salinization occurring downstream of Edmonton at the Pakan LTRN monitoring station.
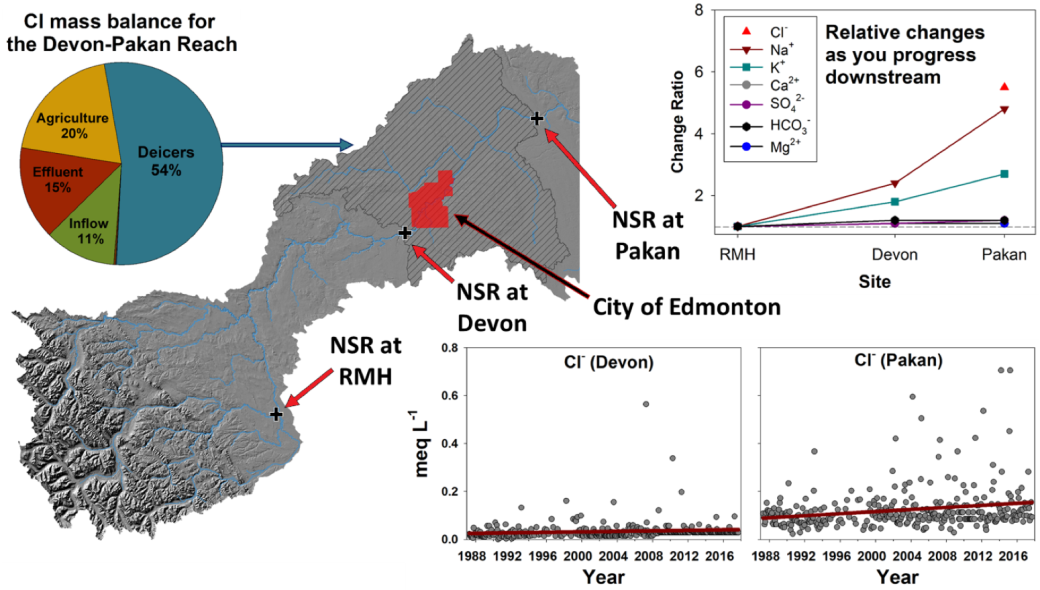
Figure 7: Major Cl- sources in the North Saskatchewan River (NSR) between AEP water quality monitoring sites upstream of Edmonton near Devon and downstream of Edmonton near Pakan between 2010 and 2017. In addition, this figure includes the relative changes in Cl- and other major ions as you progress downstream in the NSR and temporal trends of Cl- at the Devon and Pakan monitoring sites.
Related publications
- Chloride in Surface Waters of Alberta’s Rivers - Condition of the Environment Report 2021
Information on methods used to generate the chloride results. - Environmental Quality Guidelines for Alberta Surface Waters
Guidelines to protect aquatic life, tissue residues for wildlife consumers, and agricultural and recreational uses. - Canadian water quality guidelines for the protection of aquatic life: Chloride
Information on Cl- guidelines by the Canadian Council of Ministers of the Environment - Alberta’s River Water Quality Monitoring Programs
Fact sheet with information on river and stream monitoring networks. - A five-year provincial water quality monitoring, evaluation and reporting plan for lotic systems
Key scientific questions, approaches, and deliverables for monitoring and reporting on water quality within Alberta’s rivers and streams. - Guide to Surface Water Quality Data and Online Tools
Information on how to obtain Cl- and other water quality data generated from AEP’s surface water quality monitoring programs
Water monitoring
Access data and learn about how Alberta’s Environmental Science Program monitors Alberta’s water quality and quantity: Environmental monitoring.
Back to
Water