Overview
The Oil Sands Monitoring (OSM) Program released a 2025 report on the state of surface water for rivers and streams in the oil sands region, focusing on 2 main areas—water quality (what’s in the water) and water quantity (how much water there is). The work was shaped and directed by input from Indigenous, industry, and government partners involved in the OSM Program.
The approach and outcomes from this state of environment reporting initiative on surface water quality and quantity are available in a short overview and summary report, along with a full technical report.
- Read the reports: State of the Environment technical report 2025 : surface water quality and quantity in Alberta’s oil sands region
Key findings
Water quality is mostly the same before and after the oil sands area.
The findings provide information to help understand the current state of water quality and quantity in the oil sands area, and how much it has been changing over time and from one place to another. Although the monitoring results don’t show obvious widespread impacts linked to oil sands activity, they do highlight areas where there have been some changes in water quality and quantity that may need further investigation.
Water Quality
Water quality was evaluated using monitoring data compared against 25 different sets of established guidelines. These comparisons helped group the water quality results into 6 categories, based on how often and by how much water samples exceeded these screening guidelines.
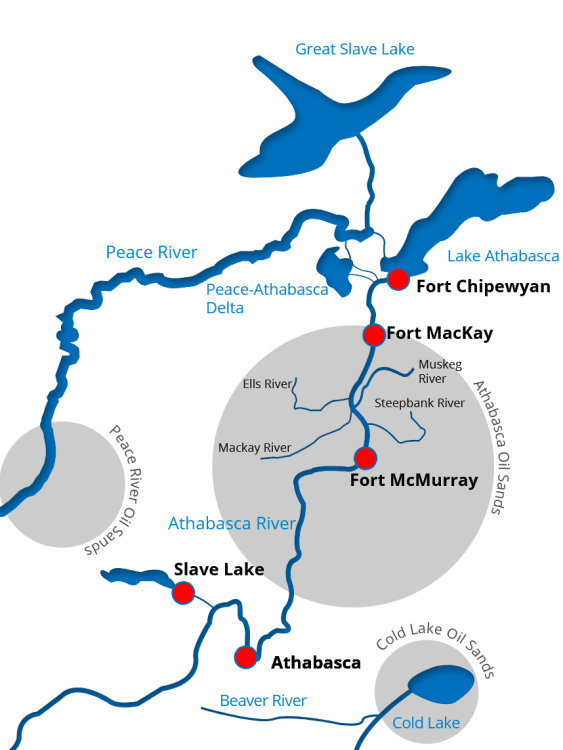
Based on this assessment, water quality didn’t show a consistent pattern of change when comparing sites upstream and downstream of oil sands activities on the Athabasca River. However, some smaller tributaries flowing into the Athabasca River, especially those in the surface mining area—for example the Steepbank and Ells Rivers—showed some increases that may require further investigation.
Changes over time in water quality show a mix of results. Along the Athabasca River, there were similar numbers of increasing trends in water quality parameters, both upstream and downstream of oil sands activity. For the Peace River, no clear or consistent patterns were observed in water quality trends across the assessed sites. Most smaller rivers flowing into the Athabasca River showed only a few notable changes.
One exception was the Muskeg River. While screening guideline exceedances on the Muskeg River followed a similar distribution as other rivers in the region, increasing trends for nickel, sulphate, and other metals and ions, were observed. However, most of these parameters remain at concentrations below, or have only been reported occasionally and slightly above guidelines.
Water quantity
Water flow in the Peace and Athabasca Rivers is complex. The Peace River usually has about three times more water than the Athabasca River and has more stable flows because of upstream dams. In contrast, the Athabasca River has shown signs of both higher and lower flows over time, suggesting that its flow has become more variable. Some locations had more or less water flow over time, but there was no clear overall pattern. For example, at Fort McMurray, flow trends show an overall decrease over the long-term, but have gone up since 1998.
Some water is taken from the Athabasca River for industrial use. These withdrawals stay about the same all year. But since the river flows less in winter, withdrawals make up a bigger share. For example, from January to April, weekly withdrawals are about 2% of the river’s flow. From May to November, they are typically less than 1%. An indicator called the “Aboriginal Extreme Flow” has been passed more often since 1990.