About the indicator
This indicator reports on the total annual and seasonal precipitation (rain and snow) across Alberta from 1950 to 2019.
Precipitation can be a key indicator of climatic changes, which can impact many things, including:
- environmental conditions
- drinking water
- agricultural activities
- water availability
- water quality
Climate change refers to any significant change in long-term climate conditions (for example, precipitation and temperature). Climate change can result from both human activities (such as emission of greenhouse gases and land-use changes) and natural factors (such as natural climate variability due to shifts in recurring climate patterns such as El Niño/La Niña).
High or extreme precipitation events may lead to flooding, increased sedimentation and water pollution generated by runoff. Low precipitation may result in droughts and less water to maintain aquatic ecosystems.
Methods
- Need for reliable climate data: Understanding climate and hydrology in Alberta requires consistent, long-term datasets. However, many regions, especially in the western mountainous and northern parts of Alberta, lack sufficient observational data.
- Use of gridded datasets: To fill data gaps, gridded climate datasets are created using spatial interpolation and modelling from station data. These datasets vary in accuracy, coverage, and consistency.
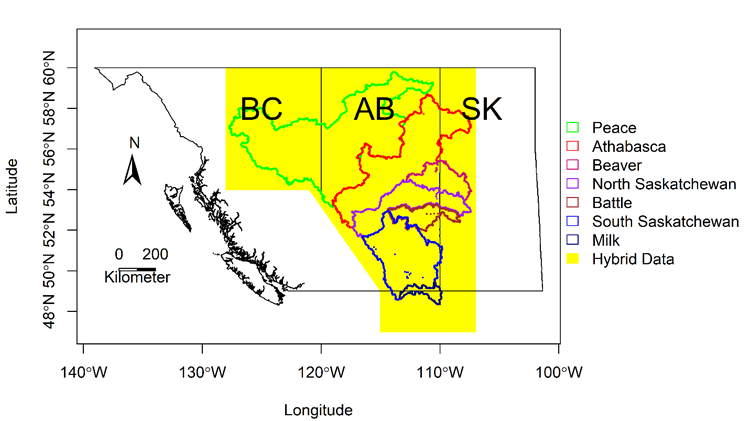
- REFRES framework: Alberta Environment and Protected Areas developed the REFerence Reliability Evaluation System (REFRES) to evaluate and combine multiple datasets into a high-quality hybrid dataset (1950 to 2019, 10 km resolution) using 5 historical gridded climate datasets (Figure 1).
- Trend analysis methods: Historical precipitation trends were analyzed using the Mann-Kendall test for significance and the Theil-Sen estimator for trend magnitude, both of which are non-parametric and suitable for climate data. Trend analysis provides an estimate of change over the period of record and is not intended to predict future precipitation.
- Results and seasonal trends: Trends are reported at a 90% confidence level, with seasonal breakdowns for spring (MAM), summer (JJA), fall (SON), and winter (DJF), covering all major Alberta watersheds.
Figure 1. Spatial coverage of the hybrid climate dataset (yellow-colored area) and the 7 major watersheds in Alberta
Summary of key results
Last updated: July 2025
- Total annual precipitation has been decreasing throughout much of the province over the past 7 decades (1950 to 2019).
- Precipitation varies with topographical characteristics across Alberta and is higher within mountainous and foothill regions compared to the grasslands.
Changes over time
- Alberta’s mean total annual precipitation is 467 mm per year, ranging from 370 mm to 569 mm per year from 1950 to 2019 (Figure 2).
- Alberta’s total annual precipitation has decreased by 4.77 mm per decade, a decrease of 33.4 mm from 1950 to 2019, or approximately 10%. This decrease is significant at the 10% statistical significance level (Table 1).
- The decreasing trend in total annual precipitation stems primarily from a significant decreasing trend in winter precipitation of 4.42 mm per decade. Less winter precipitation can lead to less snow accumulation and a potential decrease in stream flows during spring and summer.
- Year-to-year fluctuations in total annual precipitation differ over time with some years showing unusually wet and dry periods.
Figure 2. Total annual precipitation across Alberta
Table 1. Trends in total annual and seasonal precipitation in Alberta
| Indices | Slope (mm/decade) | P-value | 95% confidence interval |
|---|---|---|---|
| Annual | -4.77 | 0.0923 | [-11.20, 1.04] |
| Spring (MAM) | 0.66 | 0.5701 | [-1.72, 3.08] |
| Summer (JJA) | 2.01 | 0.3722 | [-2.94, 6.46] |
| Fall (SON) | -0.95 | 0.4780 | [-3.41, 1.92] |
| Winter (DJF) | -4.42 | < 0.0001 | [-5.70, -3.24] |
Variation across Alberta
Spatial variations in precipitation across Alberta were measured as follows:
- Total annual precipitation varies with location and topographical characteristics across Alberta. For example, more precipitation is observed within mountainous and foothill areas compared to the prairies.
- Across the province, 22.2% of 10 km x 10 km grid cells (2,074 of 9,365 grid cells) show a significant decreasing trend in precipitation and only 2.6% (240 grid cells) show a significant increasing trend (Figure 3). However, no significant trends for annual precipitation were detected in the majority of provincial grid cells (75.3%).
Figure 3. Change in total annual precipitation in millimeters per decade from 1950 to 2019
Data limitations
- The climate dataset used for these indicators has been produced by combining multiple existing gridded climate datasets that incorporate various regression and model-driven approaches. Individual climate variables (for example, temperature or precipitation) are not identical with the derived monitoring data.
- The hybrid climate dataset represents the best available gridded information for the province. However, uncertainty in the gridded data is not distributed uniformly across the province and depends on several factors including density of nearby climate stations used for interpolation and physical factors influencing localized weather.
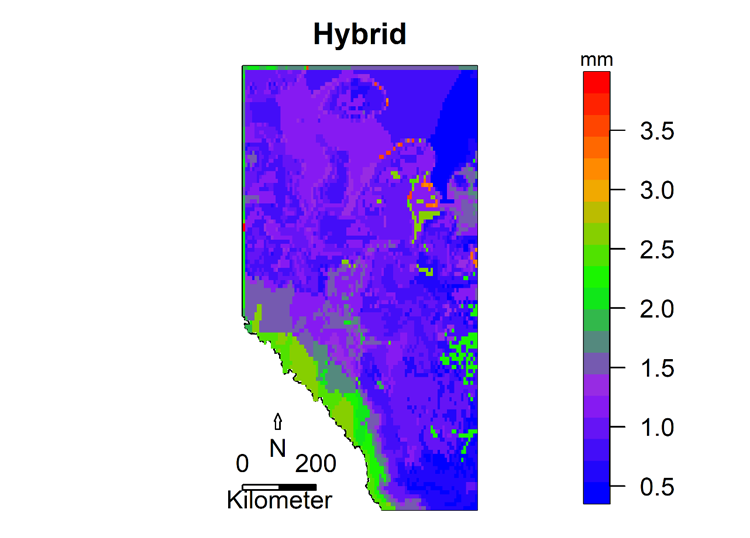
- Root mean square error (RMSE) is a measure of how well interpolated gridded data match observed station data and provides a spatial distribution of uncertainty in gridded daily precipitation. The RMSE for the hybrid dataset is consistently and relatively higher (2 to 3 mm in daily precipitation) for the Rocky Mountain region where there is both a sparsity of climate stations (especially at high elevations) and substantial influence of geography on localized weather (Figure 4).
Figure 4. Root mean square error (RMSE) in daily precipitation across the province for Alberta’s gridded hybrid climate dataset. Units for RMSE are mm
Focused study
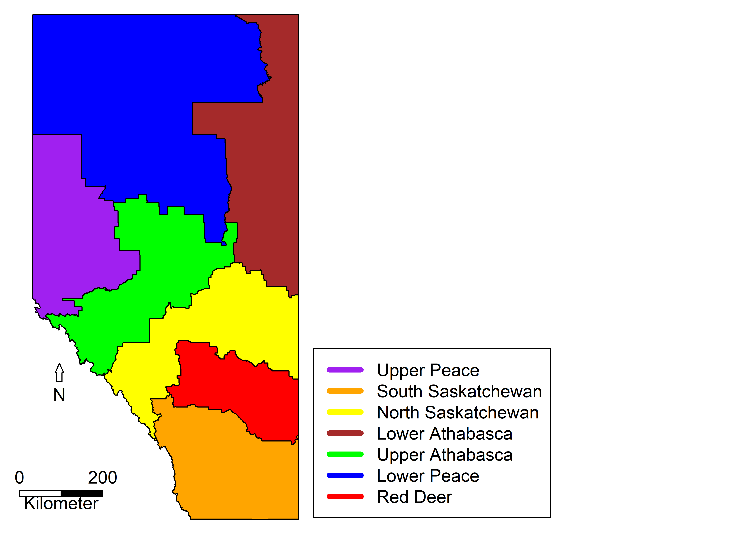
Spatial and temporal changes in total annual and seasonal precipitation were evaluated for Alberta’s 6 natural regions and 7 Land-Use Framework (LUF) regions (Figures 5a and 5b) using averages of hybrid climate data over all grid cells for the respective regions.
Figure 5a. Natural regions of Alberta
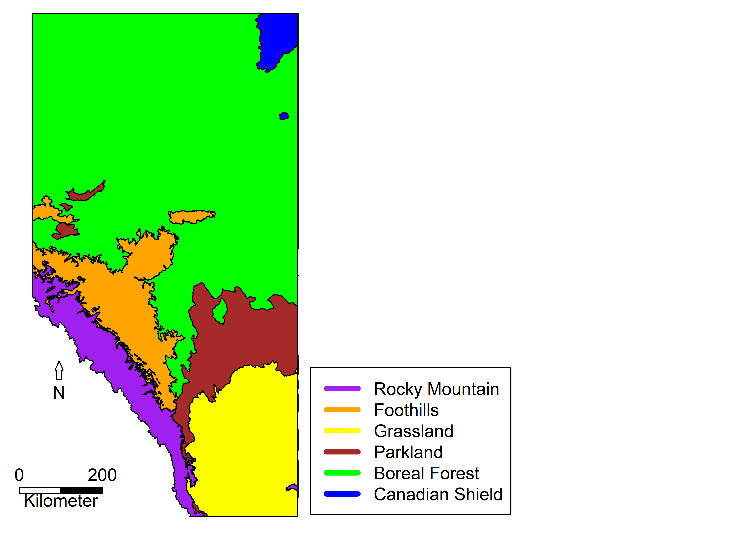
Figure 5b. LUF regions in Alberta
Natural regions
- Across the entire year, 2 of the 6 natural regions (Rocky Mountain and Parkland) showed statistically significant decreasing precipitation trends ranging from -7.94 to -13.97 mm per decade from 1950 to 2019 (Figure 6, Table 2). No natural regions showed significant increases in total annual precipitation.
- The Rocky Mountain region is the headwater (also called source water) region for Alberta’s major watersheds. Declining annual precipitation in this region could lead to potential decreases in water availability in downstream regions.
- All 6 natural regions showed statistically significant decreasing precipitation trends during winter (Figure 7, Table 3). The decreasing trends ranged from -3.48 to -11.91 mm per decade from 1950 to 2019.
Figure 6. Total annual precipitation in Alberta’s 6 natural regions
Figure 7. Total winter precipitation in Alberta’s 6 natural regions
Table 2. Trends in total annual precipitation in Alberta’s natural regions
| Natural region | Slope (mm/decade) | P-value | 95% confidence interval |
|---|---|---|---|
| Rocky Mountain | -13.97 | 0.0224 | [-24.16, -2.16] |
| Foothills | -0.67 | 0.9134 | [-12.60, 11.71] |
| Grassland | -3.68 | 0.3615 | [-12.08, 4.28] |
| Parkland | -7.94 | 0.0243 | [-15.28, -0.91] |
| Boreal Forest | -2.73 | 0.2978 | [-8.82, 3.13] |
| Canadian Shield | -4.06 | 0.2790 | [-12.70, 3.44] |
Table 3. Trends in total winter (DJF) precipitation in Alberta’s natural regions
| Natural region | Slope (mm/decade) | P-value | 95% confidence interval |
|---|---|---|---|
| Rocky Mountain | -11.91 | < 0.0001 | [-15.97, -6.88] |
| Foothills | -4.36 | 0.0028 | [-7.15, -1.81] |
| Grassland | -4.42 | < 0.0001 | [-5.84, -3.03] |
| Parkland | -4.40 | < 0.0001 | [-6.01, -2.77] |
| Boreal Forest | -3.48 | < 0.0001 | [-4.90, -2.29] |
| Canadian Shield | -4.46 | 0.0003 | [-6.95, -2.39] |
LUF regions
- Only the North Saskatchewan LUF region showed a significant precipitation trend across the entire year, and it was decreasing (Figure 8, Table 4).
- Similar to the natural regions, decreasing winter precipitation was observed in all LUF regions, ranging from -3.35 to -6.29 mm per decade (Figure 9, Table 5). Less winter precipitation can lead to less snow accumulation and a potential decrease in stream flows during spring and summer.
- Among the 7 LUF regions, Upper Peace, North Saskatchewan, South Saskatchewan and Upper Athabasca regions showed the greatest reductions in winter precipitation.
Figure 8. Total annual precipitation in Alberta’s 7 LUF regions
Figure 9. Total winter precipitation in Alberta’s 7 LUF regions
Table 4. Trends in total annual precipitation in Alberta’s LUF regions
| LUF region | Slope (mm/decade) | P-value | 95% confidence interval |
|---|---|---|---|
| Upper Peace | -4.90 | 0.3432 | [-15.52, 5.32] |
| Lower Peace | -0.61 | 0.8399 | [-8.73, 7.75] |
| South Saskatchewan | -1.21 | 0.7456 | [-11.50, 6.24] |
| North Saskatchewan | -8.81 | 0.0388 | [-17.05, -0.41] |
| Upper Athabasca | -7.49 | 0.2235 | [-18.56, 3.97] |
| Lower Athabasca | -4.98 | 0.1344 | [-11.88, 1.83] |
| Red Deer | -4.20 | 0.2870 | [-12.70, 3.82] |
Table 5. Trends in total winter (DJF) precipitation in Alberta’s LUF regions
| LUF region | Slope (mm/decade) | P-value | 95% confidence interval |
|---|---|---|---|
| Upper Peace | -6.29 | < 0.0001 | [-8.91, -3.64] |
| Lower Peace | -3.35 | < 0.0001 | [-4.70, -1.96] |
| South Saskatchewan | -5.15 | < 0.0001 | [-7.17, -3.24] |
| North Saskatchewan | -5.23 | < 0.0001 | [-7.26, -3.38] |
| Upper Athabasca | -4.87 | < 0.0006 | [-8.29, -2.35] |
| Lower Athabasca | -3.58 | < 0.0001 | [-4.76, -2.42] |
| Red Deer | -4.34 | < 0.0001 | [-5.81, -2.83] |