About the indicator
This indicator reports on annual and seasonal temperatures across Alberta from 1950 to 2019.
Air temperature is an important feature of understanding our climate and an accepted indicator of climate change. Changes in temperature can affect quality of life in many ways, including:
- crop and ecosystem health
- water availability
- disease spread
- economic growth
- snow accumulation
Climate change refers to any significant change in long-term climate conditions (example: temperature and precipitation). Climate change results from both human activities (such as emission of greenhouse gases and land-use changes) and natural factors (such as natural climate variability due to shifts in recurring climate patterns such as El Niño/La Niña).
Global average temperatures have changed over recent decades. According to a 2019 report, the annual average air temperature on land in Canada has increased by 1.7°C since 1948, which is 70% higher than the global average of 1.0°C. Visit:
Minimum and maximum temperature
- Commonly referred to as daytimes lows and highs, minimum and maximum temperature represent the coldest and warmest temperatures during a 24-hour day, respectively.
- Knowing how the hottest and coldest temperatures each year have changed over time helps Alberta plan for the future and manage natural resources in a smart and sustainable way.
Methods
- Importance of historical temperature data: A consistent and reliable temperature dataset is crucial for analyzing long-term climate and hydrological trends in Alberta, especially for planning and sustainable resource management.
- Challenges in data availability: Despite improvements in temperature monitoring networks, many regions – particularly mountainous and northern Alberta – remain under-monitored. Gridded datasets are used to estimate temperature in these areas through spatial interpolation and modelling.
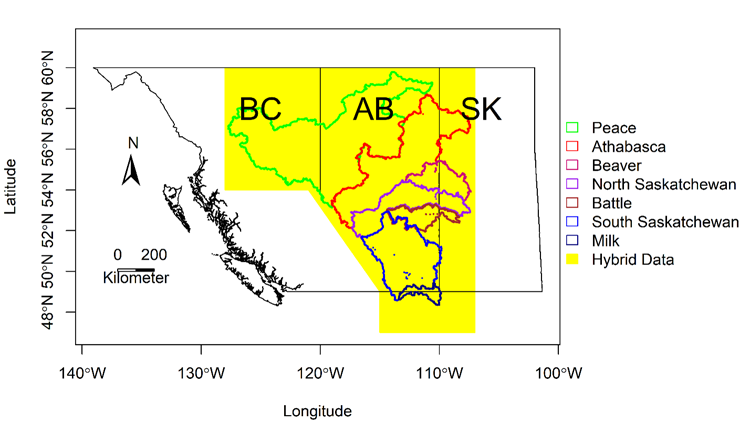
- Development of the REFRES framework: To address inconsistencies in existing datasets, Alberta Environment and Protected Areas created the REFerence Reliability Evaluation System (REFRES), which ranks and integrates multiple datasets into a hybrid product covering 1950 to 2019 at a 10 km resolution (Figure 1).
- Trend analysis methods: Temperature trends were assessed using the Mann-Kendall test for statistical significance and the Theil-Sen slope estimator for trend magnitude. These non-parametric methods are well-suited for climate data and account for serial correlation. Trend analysis provides an estimate of change over the period of record and is not intended to predict future temperatures.
- Results and seasonal analysis: Trends were evaluated across all major Alberta watersheds and reported at a 90% confidence level. Seasonal trends were analyzed for spring (MAM), summer (JJA), fall (SON) and winter (DJF), providing a comprehensive view of temperature changes over time.
Figure 1. Spatial coverage of the hybrid climate dataset (yellow-colored area) in relation to the 7 major watersheds in Alberta
Summary of key results
Last updated: July 2025
- A clear and consistent warming trend in annual mean minimum and maximum temperature was observed in Alberta from 1950 to 2019. During this period, annual mean minimum and maximum temperatures both increased by the same estimated amount of 1.89°C.
Changes over time
- Alberta’s annual mean minimum and maximum temperatures both increased by 0.27°C per decade from 1950 to 2019 corresponding to 1.89°C of warming over that period (Figure 2, Table 1).
- Annual warming trends were detected for spring, summer and winter seasons from 1950 to 2019. Warming trends were most pronounced during winter (December to February) with an increase of 4.34°C compared to 1.12°C of warming during the summer months (June to August) over the last 70 years.
- As of 2000, greater warming trends during the winter compared to summer resulted in reduced annual temperature range and smaller year-to-year temperature fluctuations (inter-annual variation).
Figure 2. Temperature in degrees Celsius (°C) for Alberta from 1950 to 2019
Table 1. Trends in annual and seasonal mean minimum and maximum temperatures in Alberta
| Variable | Indices | Slope (°C/decade) | P-value | 95% confidence Interval |
|---|---|---|---|---|
| Mean minimum temperature | Annual | 0.27 | < 0.0001 | [0.15, 0.43] |
| Spring (MAM) | 0.32 | 0.0051 | [0.09, 0.54] | |
| Summer (JJA) | 0.15 | 0.0019 | [0.06, 0.25] | |
| Fall (SON) | 0.07 | 0.6009 | [-0.16, 0.31] | |
| Winter (DJF) | 0.62 | 0.0008 | [0.27, 0.95] | |
| Maximum temperature | Annual | 0.27 | 0.0003 | [0.13, 0.39] |
| Spring (MAM) | 0.33 | 0.0092 | [0.09, 0.57] | |
| Summer (JJA) | 0.16 | 0.0110 | [0.04, 0.27] | |
| Fall (SON) | 0.05 | 0.6824 | [-0.23, 0.33] | |
| Winter (DJF) | 0.48 | 0.0038 | [0.17, 0.86] |
Variation across Alberta
Spatial variations in temperature across Alberta were measured as follows:
- Annual mean minimum and maximum temperatures increased across most of Alberta (88.6% and 87.3% of all provincial 10 km x 10 km grid cells, respectively) (Figure 3).
- Fewer significant trends were detected for annual mean maximum temperature in the south and southwest of the province.
- Fewer significant trends were detected for annual mean minimum temperature in the west central, central and south-central parts of the province.
Figures 3. Change (Δ) in annual mean minimum and maximum temperature in degrees Celsius (°C) per decade across Alberta from 1950 to 2019
Data limitations
- The climate dataset used for these indicators has been produced by combining multiple existing gridded temperature datasets that incorporate various statistical approaches. Individual climate variables (for example, temperature or precipitation) are not identical with the derived monitoring data.
- The hybrid temperature dataset represents the best available gridded temperature information for the province. However, uncertainty in the gridded data is not distributed uniformly across the province and depends on several factors including density of nearby temperature stations used for interpolation and physical factors influencing localized weather.
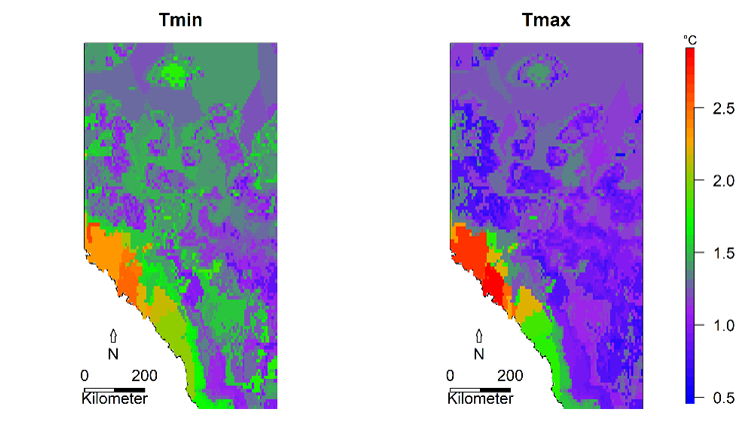
- Root mean square error (RMSE) is a measure of how interpolated gridded data match observed station data and provides a spatial distribution of uncertainty in gridded daily temperature. The RMSE for the hybrid dataset is within 1 to 2ºC for much of the province for both daily minimum and maximum temperatures (Figure 4). However, RMSE is consistently and relatively higher for the Rocky Mountain region where there are both a sparsity of climate stations (especially at high elevations) and the substantial influence of geography on localized weather.
Figure 4. Root mean square error (RMSE) for daily minimum (Tmin) and maximum (Tmax) temperatures across the province for Alberta’s gridded hybrid climate dataset
Focused study
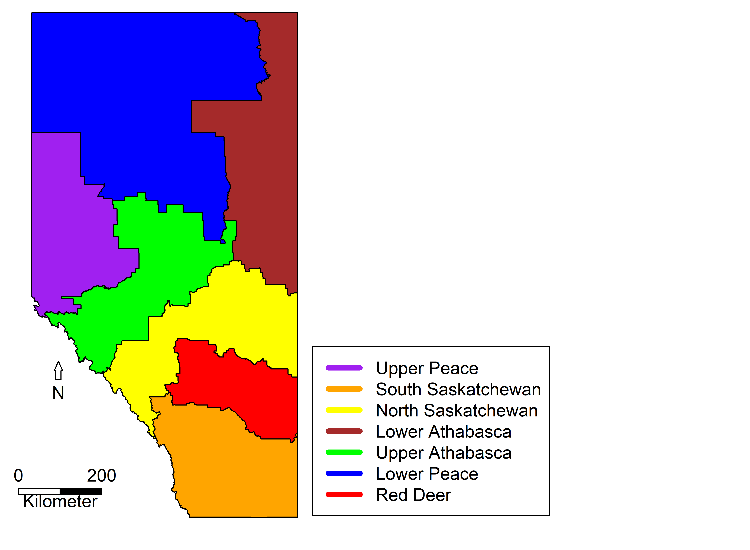
Spatial and temporal changes in annual mean minimum and maximum temperatures were evaluated for Alberta’s 6 natural regions and 7 Land-Use Framework (LUF) regions (Figures 5a and 5b) using averages of hybrid climate data over all grid cells for the respective regions.
Figure 5a. Natural regions of Alberta
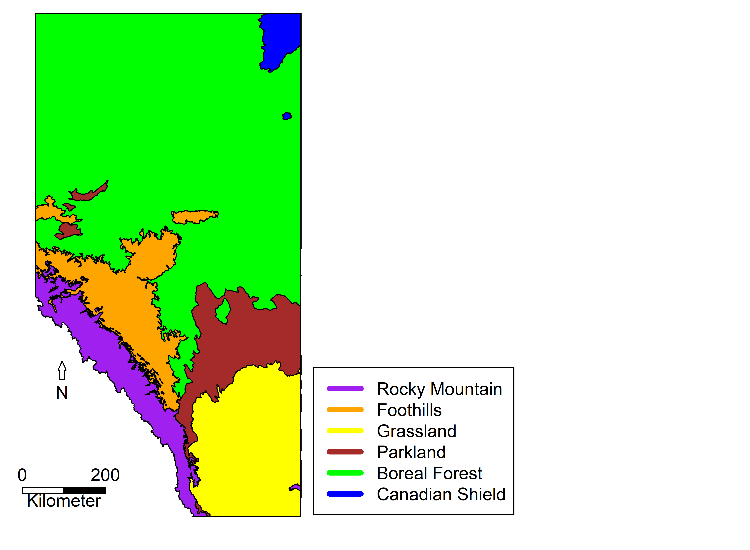
Figure 5b. LUF regions in Alberta
Natural regions
- Annual mean minimum temperature increased across all natural regions, ranging from 0.19°C to 0.43°C per decade from 1950 to 2019, corresponding to warming of 1.33°C to 3.01°C over the last 70 years (Figure 6, Table 2).
- The greatest increase in annual mean minimum temperature was observed in Alberta’s mountainous and northern regions, including the Rocky Mountain (0.25°C per decade), Boreal Forest (0.31°C per decade) and Canadian Shield (0.43°C per decade) regions.
Figure 6. Annual mean minimum temperatures in Alberta’s 6 natural regions
- Annual mean maximum temperature also increased across all natural regions, ranging from 0.14°C to 0.29°C per decade from 1950 to 2019, corresponding to 0.98°C to 2.03°C of warming over that period (Figure 7, Table 2).
- The greatest increase in annual mean maximum temperature (0.29°C per decade) was observed in the Boreal Forest region, while the smallest increase (0.14°C per decade) was detected in the Rocky Mountain region. In other words, Alberta’s north is warming faster compared to other regions in Alberta.
Figure 7. Annual mean maximum temperatures in Alberta’s 6 natural regions
Table 2. Trends in annual mean minimum and maximum temperatures in Alberta’s natural regions
| Variable | Natural region | Slope (°C/decade) | P-value | 95% confidence interval |
|---|---|---|---|---|
| Mean minimum temperature | Rocky Mountain | 0.25 | < 0.0001 | [0.15, 0.38] |
| Foothills | 0.23 | 0.0013 | [0.10, 0.37] | |
| Grassland | 0.19 | 0.0147 | [0.04, 0.33] | |
| Parkland | 0.20 | 0.0097 | [0.06, 0.35] | |
| Boreal Forest | 0.31 | < 0.0001 | [0.17, 0.47] | |
| Canadian Shield | 0.43 | < 0.0001 | [0.29, 0.56] | |
| Mean maximum temperature | Rocky Mountain | 0.14 | 0.0450 | [0.00, 0.30] |
| Foothills | 0.21 | 0.0174 | [0.04, 0.37] | |
| Grassland | 0.16 | 0.0601 | [-0.01, 0.36] | |
| Parkland | 0.18 | 0.0256 | [0.02, 0.36] | |
| Boreal Forest | 0.29 | < 0.0001 | [0.17, 0.44] | |
| Canadian Shield | 0.22 | 0.0027 | [0.07, 0.36] |
LUF regions
- Annual mean minimum temperature increases were detected across all LUF regions, ranging from 0.21°C to 0.37°C per decade and 1.47°C to 2.59°C over the past 70 years (Figure 8, Table 3).
- Larger changes in annual mean minimum temperature per decade were observed in the Lower Peace and Lower Athabasca, indicating greater warming across northern regions in Alberta.
Figure 8. Annual mean minimum temperatures in Alberta’s LUF regions
- Annual mean maximum temperature increased across 6 of the 7 LUF regions, ranging from 0.16°C to 0.32°C of warming per decade and equating to an increase of 1.12°C to 2.24°C over the past 70 years (Figure 9, Table 3).
- The Upper/Lower Peace and Upper/Lower Athabasca regions showed greater increases in annual mean maximum temperature (0.24°C to 0.32°C per decade) compared to the South/North Saskatchewan regions.
- No trend was detected for annual mean maximum temperature in the Red Deer region at the 10% significance level.
Figure 9. Annual mean maximum temperatures in Alberta’s LUF regions
Table 3. Trends in annual mean minimum and maximum temperatures in the LUF regions
| Variable | LUF region | Slope (°C/decade) | P-value | 95% confidence interval |
|---|---|---|---|---|
| Mean minimum temperature | Upper Peace | 0.22 | 0.0021 | [0.08, 0.36] |
| Lower Peace | 0.32 | < 0.0001 | [0.18, 0.47] | |
| South Saskatchewan | 0.21 | 0.0017 | [0.07, 0.35] | |
| North Saskatchewan | 0.23 | 0.0004 | [0.11, 0.38] | |
| Upper Athabasca | 0.26 | 0.0002 | [0.13, 0.38] | |
| Lower Athabasca | 0.37 | < 0.0001 | [0.21, 0.53] | |
| Red Deer | 0.22 | 0.0081 | [0.06, 0.35] | |
| Mean maximum temperature | Upper Peace | 0.24 | 0.0072 | [0.07, 0.40] |
| Lower Peace | 0.32 | < 0.0001 | [0.21, 0.48] | |
| South Saskatchewan | 0.16 | 0.0485 | [0.00, 0.34] | |
| North Saskatchewan | 0.19 | 0.0143 | [0.04, 0.34] | |
| Upper Athabasca | 0.24 | 0.0060 | [0.08, 0.39] | |
| Lower Athabasca | 0.24 | 0.0002 | [0.11, 0.40] | |
| Red Deer | 0.16 | 0.1006 | [-0.03, 0.35] |