Overview
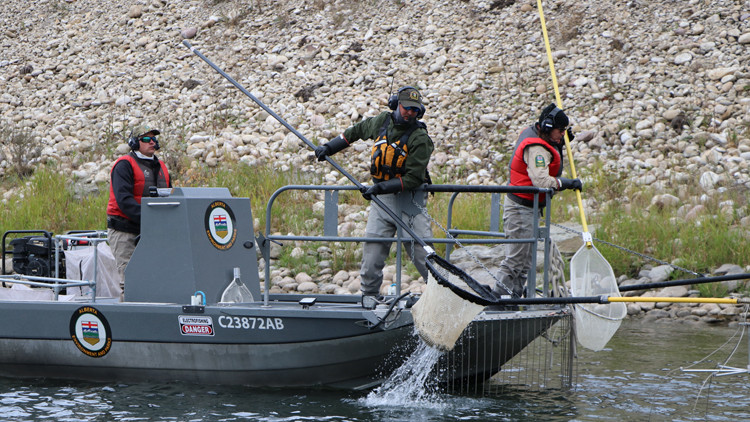
Fisheries biologists electrofishing on a boat in the Bow River.
To assess a fish population within flowing waters, river surveys use standardized electrofishing methods:
- from a boat for large river surveys
- with a backpack or tote for wadable rivers
When river surveys are conducted
All river surveys typically occur between June and August when lower water flows allow for safe working conditions, reduced conductivity, and increased visibility for fish capture. Additionally, fish are more evenly distributed within watersheds, increasing the chances of detection, reducing variability among sampling sites and avoids sampling during spring and fall spawning periods.
Environmental variables and sampling efficiency
Sampling flowing waters can be difficult as sampling efficiency can be affected by environmental variables such as:
- channel width
- instream obstructions
- water depth, turbidity and velocity
Using standardized techniques helps address these variables.
Sample site selection
The number of sample sites within a watershed are spatially balanced and randomly selected to ensure sites are not clumped. This method also ensures enough sites are sampled to allow for data comparison.
Data collected through river surveys
For each watershed surveyed, relative abundance of fish (catch per unit effort) and biological data (fish length) are collected to understand a population’s status. Information is collected from all fish species encountered to provide an understanding of fish community structure.
Basic water quality information is also collected, such as temperature, conductivity, turbidity, and measures of river habitat like width and substrate type. Any notable observations or habitat disturbance are also recorded.
How survey data is used
Catch rates
Catch rates of fish species are an indication of relative abundance. Consistently, higher catch rates correspond to more fish. Catch rates are measured as follows:
| For backpack electrofishing | Number of fish caught per 300 metres |
|---|---|
| For float/boat electrofishing | Number of fish caught per one kilometre |
Fish size distribution
The distribution of sizes of fish can also provide clues on what factors may be limiting the population. For example:
- Few large fish can indicate problems with overharvest.
- Few small fish may be a sign that spawning habitat quality is poor.
River survey data and the Fish Sustainability Index
River survey data, as well as data on water quality, access, development and habitat threats is used to inform Alberta's Fish Sustainability Index (FSI). The FSI gives each population a score from very low to very high risk to sustainability.
The FSI brings consistency to individual fish stock assessments and provides a province-wide evaluation of the status and sustainability of Alberta fish species. Using this information, fisheries biologists can determine if management actions are achieving desired fisheries management objectives, or if other management actions need to be taken.
Fish species recovery and management
River surveys are also linked to recovery planning for species at risk such as Bull Trout, Westslope Cutthroat Trout, and Athabasca Rainbow Trout. Standard methods also support disease monitoring and mitigation, invasive species management, and the Watercourse Crossing Program.
Resources
Contact
Connect with Environment and Protected Areas Outreach Services team:
Hours: 8:30 am to 4:30 pm (open Monday to Friday, closed statutory holidays)
Email: [email protected]