This is not a forecast. It is a summary of the situation in Alberta in 2025.
Methodology
The Alberta bertha armyworm (Mamestra configurata) monitoring program was established in 1995. Now a group of dedicated partners made up of agronomists, agricultural fieldmen and farmers maintain the pheromone trap network. Agriculture and Irrigation organizes the network of pheromone traps and maintains the map and the web-based reporting application. The Prairie Pest Monitoring Network provides the traps and lures.
In 2025, the network was made up of 280 sites of pheromone-baited traps across Alberta. These traps help to determine the density and distribution of moths. Moth counts from the traps are submitted weekly using a web-based application from a smart phone.
Without dedicated partners, such a comprehensive monitoring system would not be possible. Thank you to everyone who has participated in 2025.
2026 spring update
As of March 2026, we are anticipating variable, but generally low overwintering mortality of bertha armyworm pupae. Winter conditions have been generally mild. Parts of southern Alberta that had little snow coverage may see survival rates of around 60 percent. In the rest of the province, survival likely is 80 percent or higher.
Bertha armyworm populations are impacted by many other factors, but winter conditions are important. Watching the live map results will be important in 2026.
2025 survey findings
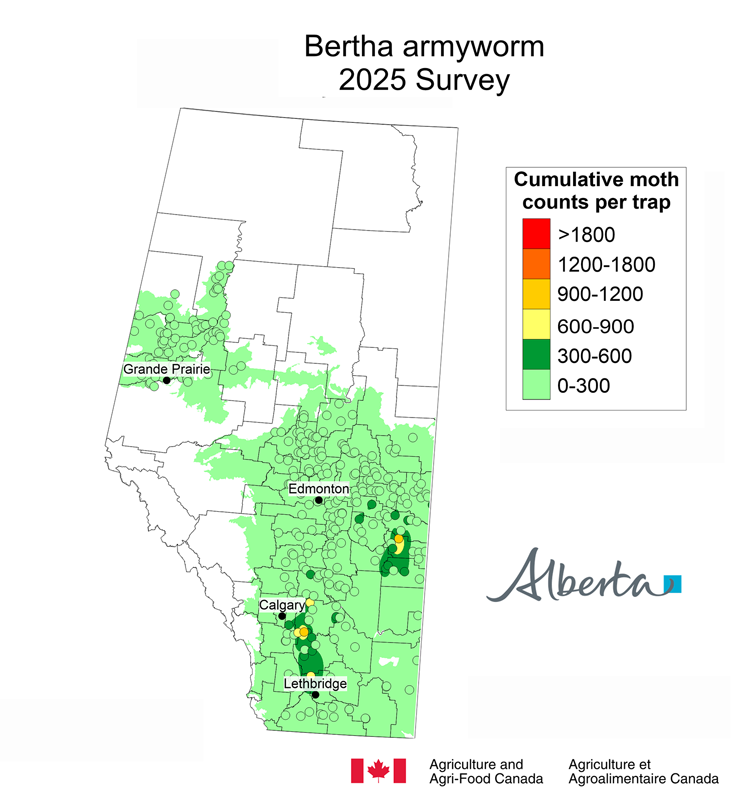
In 2025, bertha armyworm populations had a slight increase in central Alberta. Some spraying was reported in eastern portions of this area. While most locations reported low moth capture, there were localized hot spots. Trap capture decreased in the Peace Region, but scouting individual fields will still be important.
While it is difficult to accurately predict the 2026 bertha armyworm populations based on the 2025 moth catch, bertha armyworm may continue to increase in 2026. Other prairie provinces experienced very high bertha armyworm numbers in 2025, so populations must be followed closely to track potential outbreaks. It will be critical to have good coverage of pheromone traps in 2025 to provide an early warning of potential problems during the growing season.
Snow cover encourages successful overwintering, in contrast low snow cover with cold temperatures reduces winter survival. Monitoring, even in low flight years, allows us to pick up trends and better predict when bertha armyworm populations start to build-up and lead into new outbreaks.
Potential damage from bertha armyworm may be more or less severe than suggested by the moth count data depending on weather and crop conditions and localized population dynamics. An insecticide application is recommended when the larval numbers meet the economic threshold.
During the monitoring season, the reported trap counts are displayed on a Google map. The map allows the viewer to zoom in and click on the individual balloons. Clicking on a balloon will display the organization responsible for the trap location, municipality where the trap is located, and both the weekly and cumulative counts. All counts displayed are the average of the two traps at the site. During the trapping period, the information is updated as the entries are made into the data collection website. The resolution is not so fine as to pinpoint the exact location of individual trap locations.
The objective of the monitoring is to increase the awareness of canola producers to the damage potential of bertha armyworm. Forecast maps DO NOT replace field scouting. No field should be treated for bertha armyworm without proper field scouting. Moth catches indicate the potential for damage but the actual populations must be assessed.
Experience from previous outbreaks has shown us that adjacent fields or even different parts of the same field can have greatly different bertha armyworm numbers. Although traps are set in canola fields, producers growing flax, peas, faba bean and quinoa also need to pay attention to this system as this insect is also known to feed on these crops.
Historical population maps
- 2024 Survey Map
- 2023 Survey Map
- 2022 Survey Map
- 2021 Survey Map
- 2020 Survey Map
- 2019 Survey Map
- 2018 Survey Map
- 2017 Survey Map
- 2016 Survey Map
- 2015 Survey Map
- 2014 Survey Map
- 2013 Survey Map
- 2012 Survey Map
- 2011 Survey Map
- 2009 Survey Map