Government mail service may be affected by the Canada Post labour disruption. Learn about how critical government mail will be handled.
Overview
The Alberta Climate Information Service (ACIS) features an online interactive Historical Weather Data Viewer that allows users to view interpolated daily metrological records for 6,900 points across the province back to 1961. Users can investigate historical trends and climate variability for most locations in the province. Data can be viewed as tables or graphs, or downloaded for further analysis.
Through the viewer, data is available for each township center in the province. This data was generated using an interpolation technique that uses all available meteorological station data within a predefined distance of the township center each and every day. The interpolation is done in such a way that measurements (observations) from nearby stations influence the estimated value more than stations that are further away. This way, the influence of the station observation is directly and inversely proportional to the distance the station is from the township center.
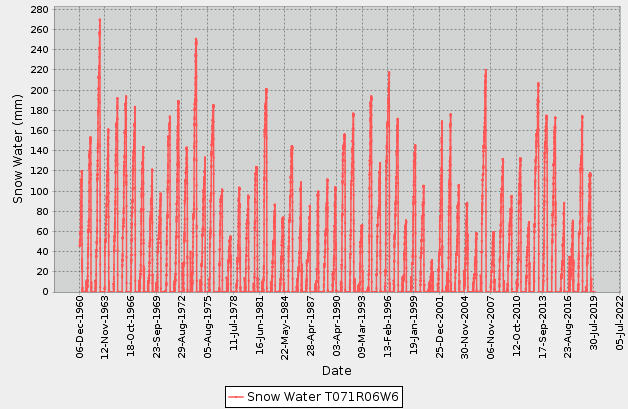
Figure 1 shows one of several types of graphs that can be made showing trends and variability in snow packs in the Grande Prairie area. In addition, other data such as precipitation, temperature, solar radiation and humidity can be retrieved.
Figure 1. Trends and variability in snow packs in the Grande Prairie area over a 58-year period
Using the Data Viewer
Figure 2. User interface for the historical weather data viewer

To start, go to the Historical Weather Data Viewer.
- Select a top navigation tab: Make Your Township Selection (1)
This tab displays a map with all the township grids. Users can select or remove their townships of interest by simply clicking on the township.
Alternatively, a search box (2) in the lower right allows users to type the name of the township they’re looking for.
- Once a township selection is made, click on the Visualize Data (3) tab to select the meteorological elements of interest.
Figure 3. Reviewing data using the visualize data tab
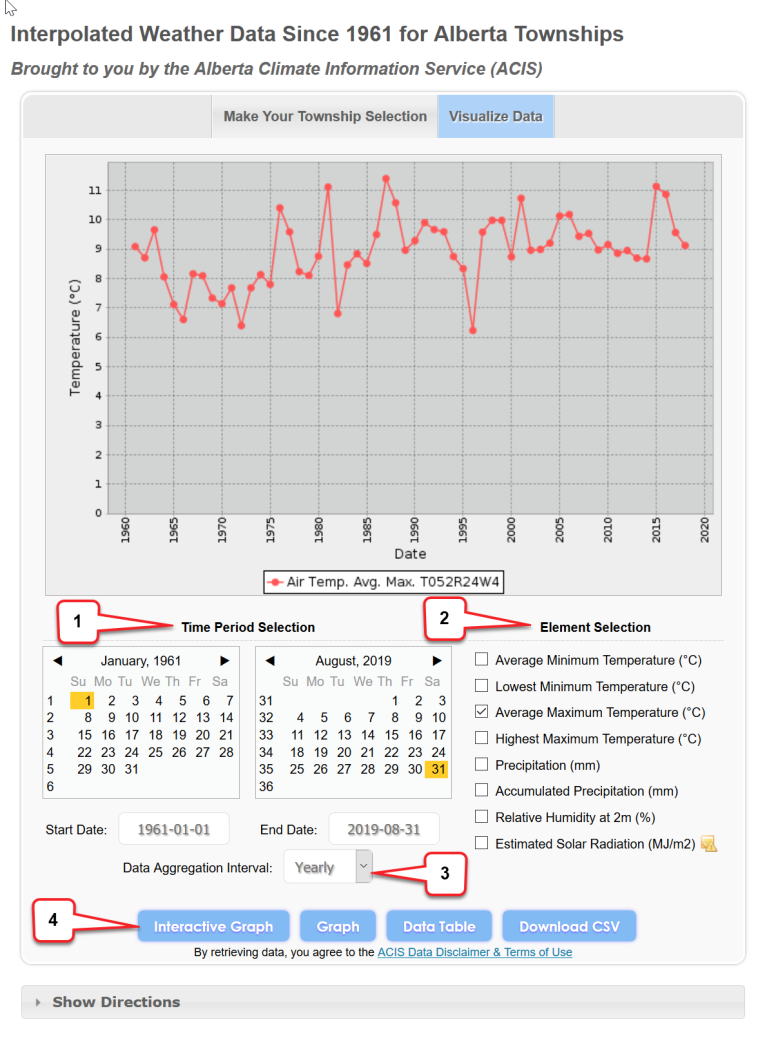
- On the Visualize Data screen, use the calendar (1) to select Start and End dates.
- After selecting a date range, select the desired Elements of interest (2) and the Data Aggregation Interval (3).
- Choose a format for viewing the data: interactive graph, static graph or data table, or download CSV (4).
Contact
Connect with the Agro-meteorology unit:
Hours: 8:15 am to 4:30 pm (open Monday to Friday, closed statutory holidays)
Phone: 780-427-3556
Back to
Weather and climate resources