Overview
The Alberta Climate Service (ACIS) hosts the Current and Historical Alberta Weather Station Data Viewer. This online interactive map allows users to view meteorological data from over 400 provincially and federally run stations. The stations transmit hourly observations for a variety of weather elements, including precipitation, temperature humidity, wind speed and wind direction. The Data Viewer allows you to view, graph and download meteorological data in hourly, daily and yearly time steps. In addition to weather observations, the viewer allows users to compare observations to average values and other types of time series derived from the data, such as crop heat units, evaporation, frost probabilities and fire weather indices.
Using the Data Viewer
Figure 1. Station markers turn green for those stations that measure the selected element
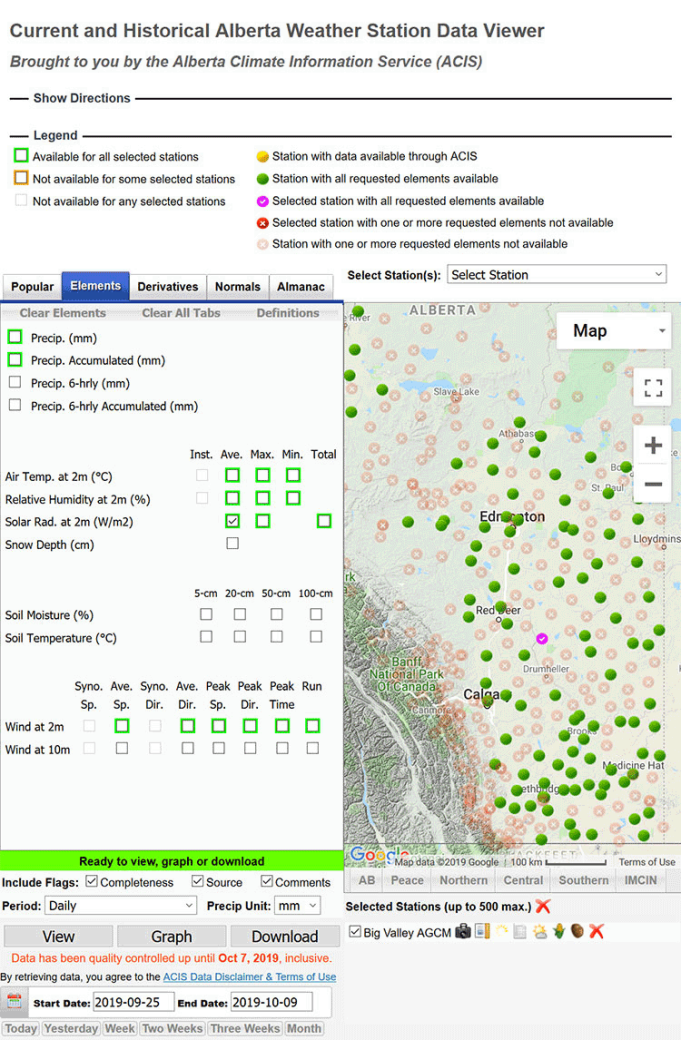
The Station Data Viewer is arranged into 4 main parts (Figure 1):
- The right half of the viewer window shows a map with the locations of operating weather stations.
- On the left, tabs along the top allow you to select various elements and derivatives using checkboxes in the pane below.
- Below the element check boxes, drop-down menus let you select the time step (hourly, daily, monthly, yearly). A calendar is used to specify a date range. The buttons below allow you to request the output (View, Graph, Download).
- Below the map, the stations you select are listed along with icons offering a picture of the station (where available) and station-generated reports.
The viewer’s user interface is dynamic and provides hints on which elements are available at each station. After you select an element, the map markers with that element light up green (Figure 1). Similarly, by selecting a station the Element check boxes will turn green to indicate which elements are available from the selected stations. The legend above the map defines the various colour and symbol changes that occur between the selection boxes and the map symbols.
Each tab provides several check boxes allowing elements and derivatives to be selected:
- Popular: this tab lists more frequently and commonly used elements and also allows retrieval of long-term normals for comparison
- Elements: this tab provides access to all elements which are measured at a meteorological station. Note that not all elements are measured at all stations.
- Derivatives: this tab provides access to many different calculated values that utilize meteorological data, such as growing degree days, wind chill, fire indices, evapotranspiration and more.
- Normals: this tab allows you to generate long term normals for many different elements and includes frost probabilities as well.
- Almanac: this tab allows access to several elements and derivatives rolled up yearly back as far as 1961. The Almanac is useful for identifying trends and understanding variability. Note that it only works when the yearly period is selected.
Contact
Connect with the Agro-meteorology unit:
Hours: 8:15 am to 4:30 pm (open Monday to Friday, closed statutory holidays)
Phone: 780-427-3556