Overview
High salt concentrations in the soil prevent the uptake of water and essential nutrients by plant roots. This in turn restricts plant growth and reduces crop yields. In Alberta, salts occur naturally in many bedrock deposits and in some deposits that lie on top of the bedrock. Groundwater flowing through these deposits dissolves and transports the salts. Under certain conditions, groundwater rises to the soil surface where the water evaporates, leaving the salts behind.
Over time, the salts accumulate on the soil surface. A white salt crust forms where the salt concentration is very high. Only salt-tolerant plants grow in this visibly saline area. The land around the visibly saline area will also have saline subsoil, resulting in reduced crop yields.
Various measures can be used to prevent, control and reduce the flow of groundwater that leads to dryland saline seep formation. For more information see Chapter 2.3 Soil Salinity, Environmental Manual for Crop Producers in Alberta.
Salinity mapping in Alberta
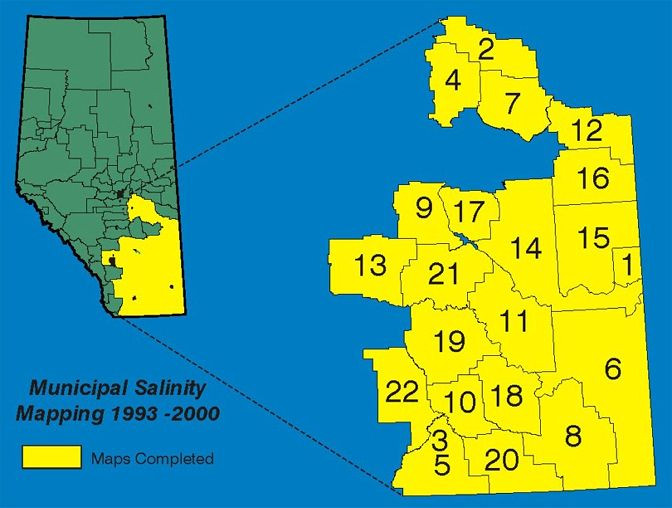
In the 1990s, the Alberta government partnered with interested counties to map visible salinity from aerial photographs and other data sources. The following image shows the counties that have reports and maps available on this page.
Image 1. Counties surveyed during soil salinity mapping project
Caveats
The method of mapping salinity used in these reports and maps relied heavily on air photo interpretation. To strengthen interpretation, field visits were made to verify what was seen on the air photos. For this reason, these maps show visible salinity only. Like looking at an iceberg, there is a lot below the surface we don't see; the extent and intensity of below-ground salinity is not shown in these maps.
Since these mapping projects were done in the mid-1990s, the resulting maps and reports are a snapshot of how salinity looked back then.
How to use the maps
- The PDF maps are tiled into convenient, letter-sized page formats.
- The maps are formatted to print on 8 ½ x 11” paper.
- Zoom into any close-up view of a portion of a map then, in your print dialogue window, select "current view" to only print that enlarged view.
- By clicking on the legend heading, you will zoom into the legend page which can be printed separately from an enlarged map view.
Download reports and maps
| No. on map above | County |
|---|---|
| 1 | Acadia |
| 2 | Beaver |
| 3 | Blood Indian Reserve |
| 4 | Camrose |
| 5 | Cardston |
| 6 | Cypress |
| 7 | Flagstaff |
| 8 | Forty Mile |
| 9 | Kneehill County |
| 10 | Lethbridge |
| 11 | Newell |
| 12 | Provost |
| 13 | Rocky View |
| 14 | Special Area 2 |
| 15 | Special Area 3 |
| 16 | Special Area 4 |
| 17 | Starland County |
| 18 | Taber |
| 19 | Vulcan |
| 20 | Warner |
| 21 | Wheatland |
| 22 | Willow Creek |