See event listings and more articles in this edition of Agri-News: December 13, 2021 issue
High crop prices offsetting low crop yields
‘Alberta’s 2021 average crop yields were significantly reduced by drought,’ says Neil Blue, provincial crops market analyst with the Alberta government. ‘On individual farms, yields varied from almost no yield to average yields. Moisture preservation with the now widely adopted minimum or no-till practices helped reduce the impact of limited growing season moisture.’
Crop prices this fall are historically high and some crop prices are record high. Some of the increased price has resulted from the dryness in Western Canada and the northwestern United States, while some of the increased price is due to factors beyond North America.
There is a large variation in economic circumstances of Western Canadian crop farmers this fall, depending on their crop yields, whether or not they purchased crop insurance and at what coverage levels, and whether or not they needed to settle shortfalls on contracted production.
‘Although averages provide little consolation to those producers who experienced a 2021 crop failure, an estimate of potential 2021 crop income using estimated average yields and this fall’s average crop prices provides some interesting information on the financial state of crop farmers.’
Figure 1 shows a comparison of estimated Alberta 2020 and 2021 yields for the 6 highest volume of production crops. Average yield estimates are still being refined.
Figure 1. 2020 vs. 2021 average yields of Alberta crops (bu/ac)

Source: Statistics Canada and the Alberta government
Figure 2 shows a comparison of fourth quarter 2020 and 2021 prices for those 6 highest volume crops.
Figure 2. Fall 2020 vs. fall 2021 average crop prices ($/bu)
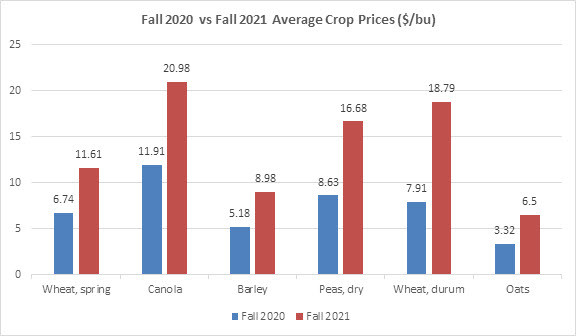
Source: Alberta government
Gross income is a combination of yield and price. Using the estimated average yields and average fourth quarter prices as shown above, the comparative gross income for each crop is calculated. Potential payments from crop insurance are not included.
Figure 3. Fall 2020 vs fall 2021 comparative crop gross income ($/ac)
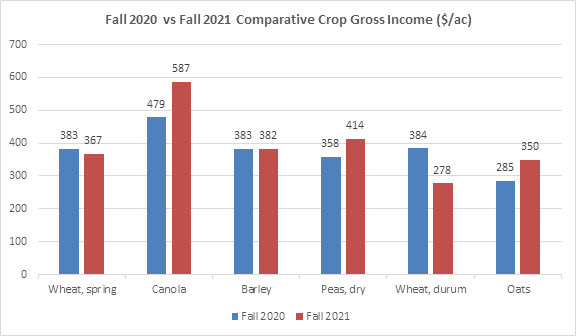
Source: Alberta government
‘Using the average yields and prices, there is a significant offset of the below average yields by the high crop prices. Of the 6 highest volumes of production crops in Alberta, only durum is showing a significant drop in gross income when prospects are compared to the fall of 2020,’ says Blue.
‘Most of the current prices for these crops are higher than the 2021 price averages used in the calculation. Depending on their coverage levels, producers with AgriInsurance that are in a crop shortfall position will have crop insurance proceeds to supplement their crop sales income.’
Contact
Connect with Neil Blue:
Hours: 8:15 am to 4:30 pm (open Monday to Friday, closed statutory holidays)
Phone: 780-422-4053
Toll free: 310-0000 before the phone number (in Alberta)
Email: [email protected]
For media inquiries about this article:
Phone: 780-422-1005
Sign up for Agri-News
Start every Monday with the week’s top agricultural stories and latest updates.
Read about all things agriculture at Alberta.ca/agri-news