Overview
An interpolated data set was used to generate a series of historical maps that depict extreme precipitation events over several different accumulation intervals, ranging from one to 90 days. These maps – shown below on this page – offer guidelines for understanding how much moisture can be delivered during excessively wet episodes that occurred during the 1961 to 2018 period. This data can help you calculate and assess the magnitude and extent of extreme precipitation events.
For more information, see Methodology and Data Sources for Interpolated Data.
Methodology
To create this set of maps, for each interval (1, 2, 3, 7, 15, 30, 60 and 90 days) the maximum total accumulations that occurred during each year were found by moving a sliding window through the data, one day at a time. The resulting yearly maximums were sorted and, from this list, the highest and second-highest accumulated values were mapped.
This method likely results in a conservative estimate of the second highest accumulations since only one value was retained for each year. It is possible that in some years multiple large accumulations were separated by several days. Since there is no standard definition describing when an event or series of events ends and a new one(s) begins, it’s difficult to specifically delineate separate events that occur relatively close together.
The data portrayed in these maps was generated for each township center, roughly a 10 x 10 km grid, from all available climate stations within a 60 km radius. An inverse cubed distance weighting scheme was used. The closer the station was to the township center, the greater its measurements influenced the estimated precipitation total.
Note that these maps are for information purposes only. For Engineering or other design purposes, see Environment Canada’s Engineering Climate Datasets.
Using the Data Viewer
The data used to generate the maps below is available in a daily time step from 1961 onward. The Historical Data Viewer allows users to explore a variety of climate elements through interactive graphs and tables, or by downloading data.
To explore extreme precipitation events in more detail, use the Data Viewer’s interactive graphing tool. For example, Figure 1 shows that maximum estimated rainfall accumulations for Stettler (located 80 km east of Red Deer) ranged from 150 to 175 mm. To view the data and find out when that was and exactly how much fell, follow these directions:
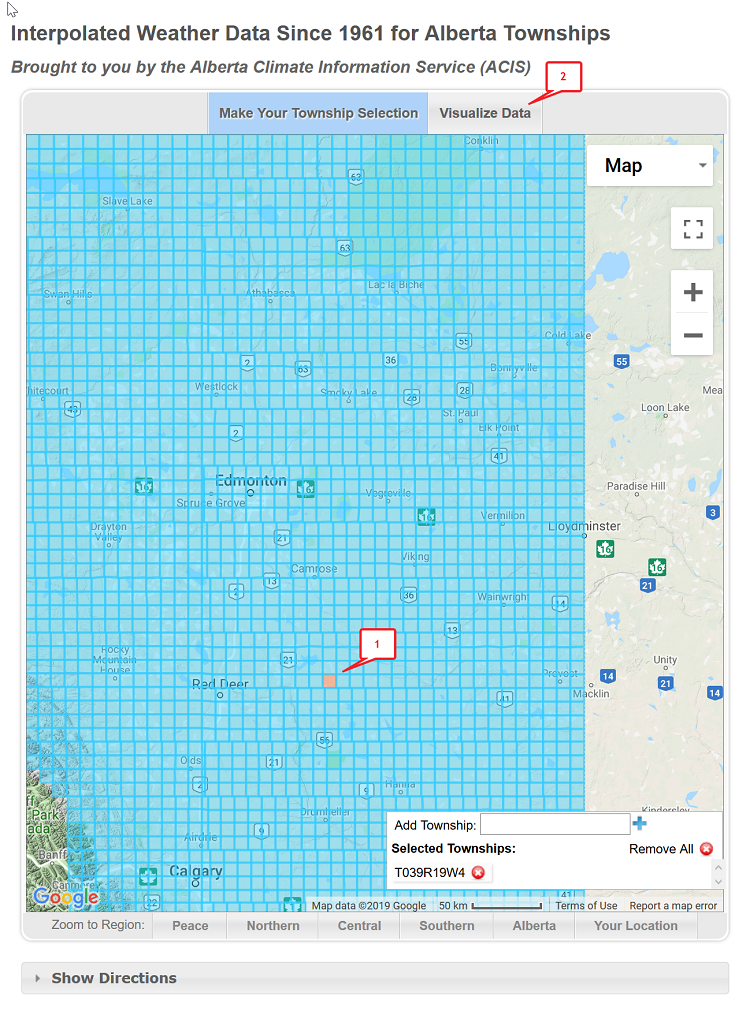
Step 1. Select township
- Navigate to the Historic Data Viewer and select the township that contains the town of Stettler.
- Select the Visualize Data tab.
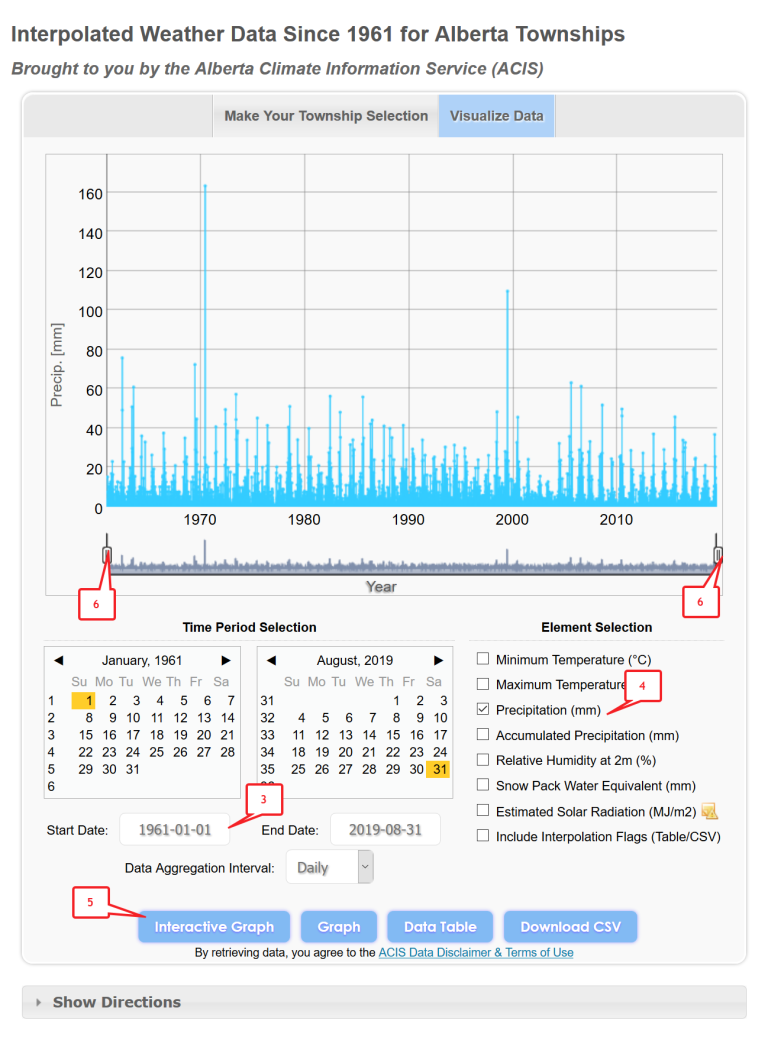
Step 2. Choose data visualization criteria
- Select the start date of 1961 (hint simply type in the date using the yyyy-mm-dd format).
- Check the Precipitation (mm) box.
- Click the Interactive Graph button.
- You can zoom in by using the sliders to get a very close look at the event and the days surrounding it.
Entering these search terms will generate a graph of all the daily total rainfall accumulations interpolated for that township from 1961 to the current data shown. It is immediately evident that the single highest accumulations occurred in the early 1970s.
Mousing over the graph reveals that the day with the highest rainfall occurred on June 30 1970, and a total of 163.2 mm fell on that day. Alternatively, you can download the data and look at it in a spread sheet or perform further analysis.
Maps of extreme precipitation events
Figure 1. One-day total precipitation accumulations, maximum- and second-highest
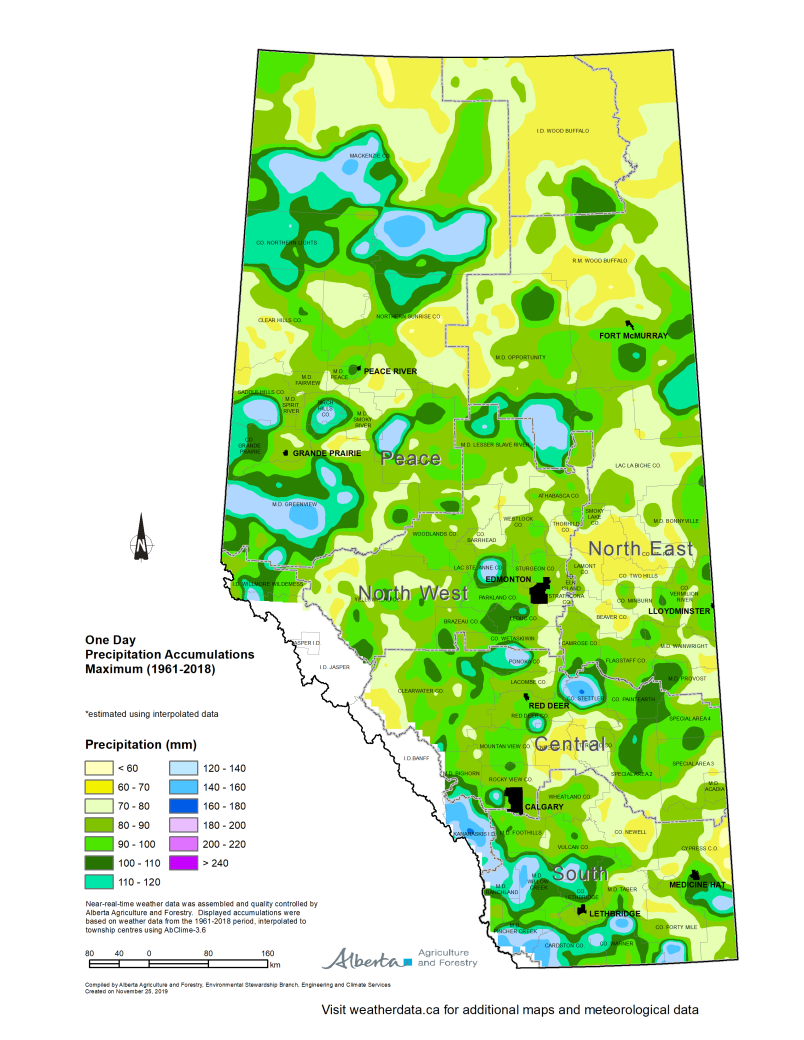
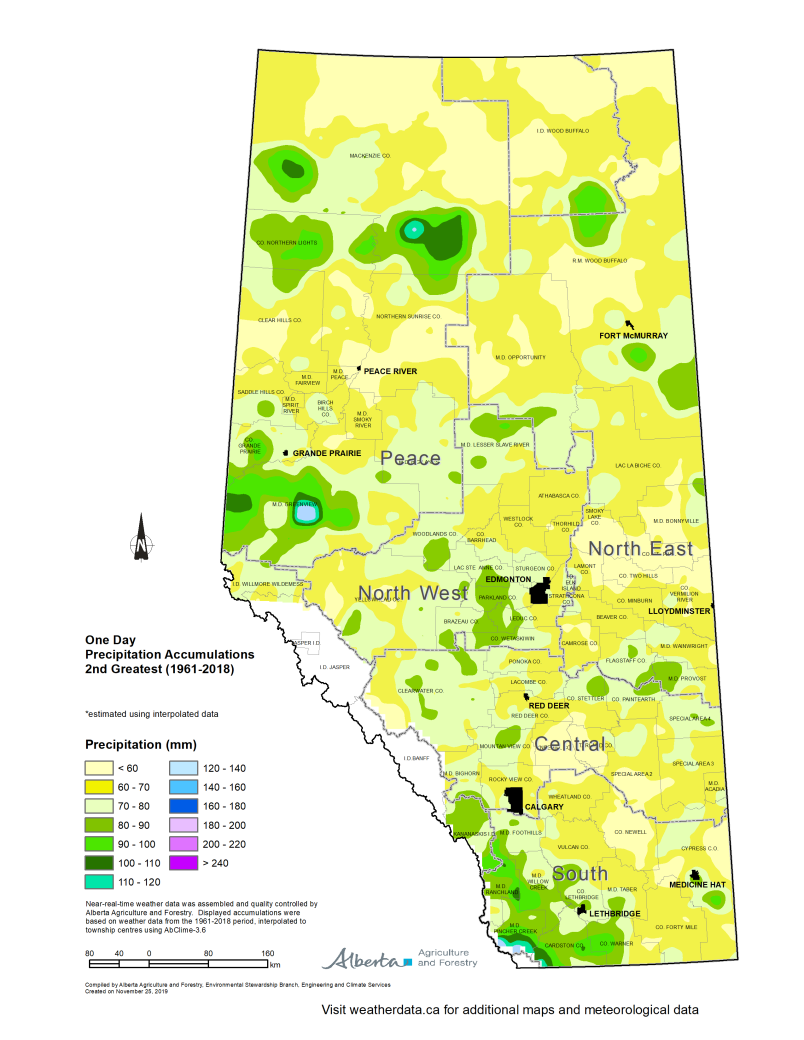
Figure 2. 2-day total precipitation accumulations, highest and second highest
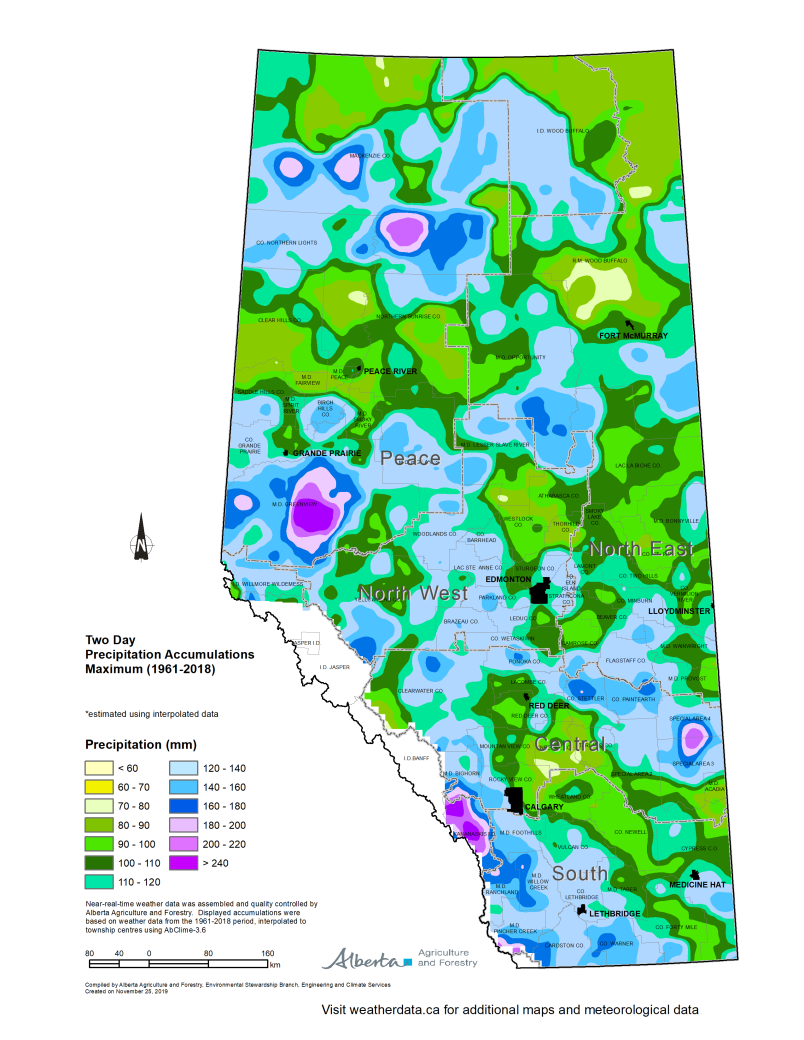
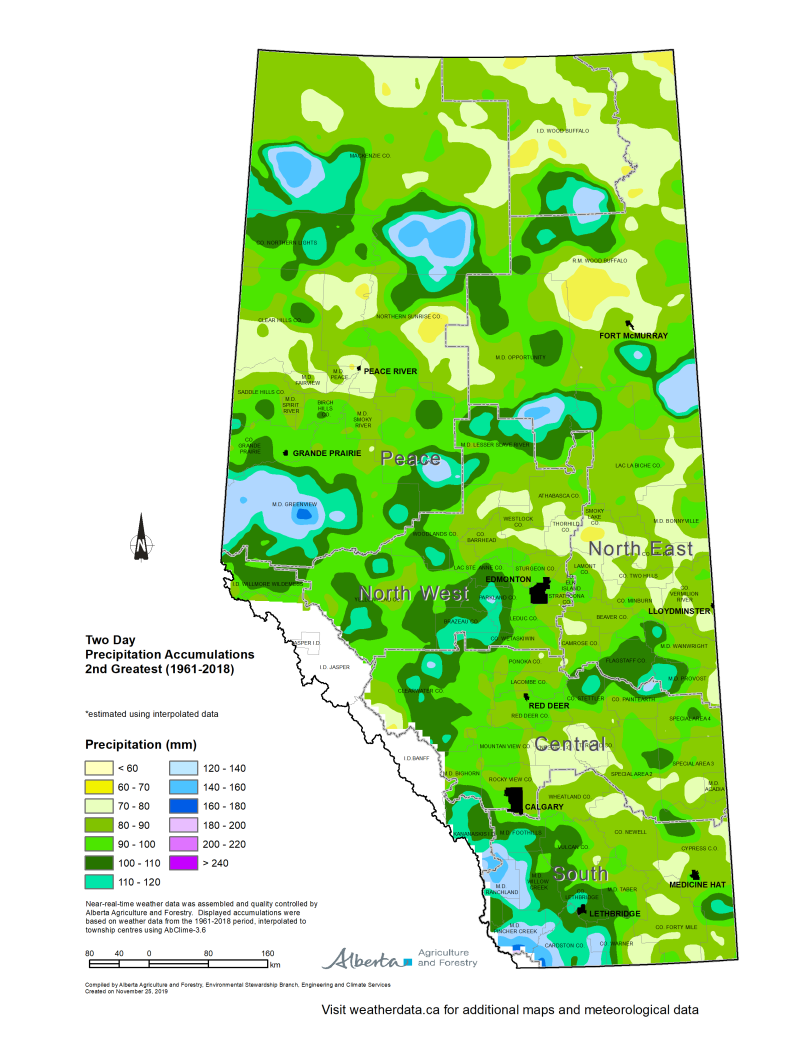
Figure 3. 3-day total precipitation accumulations, highest and second highest
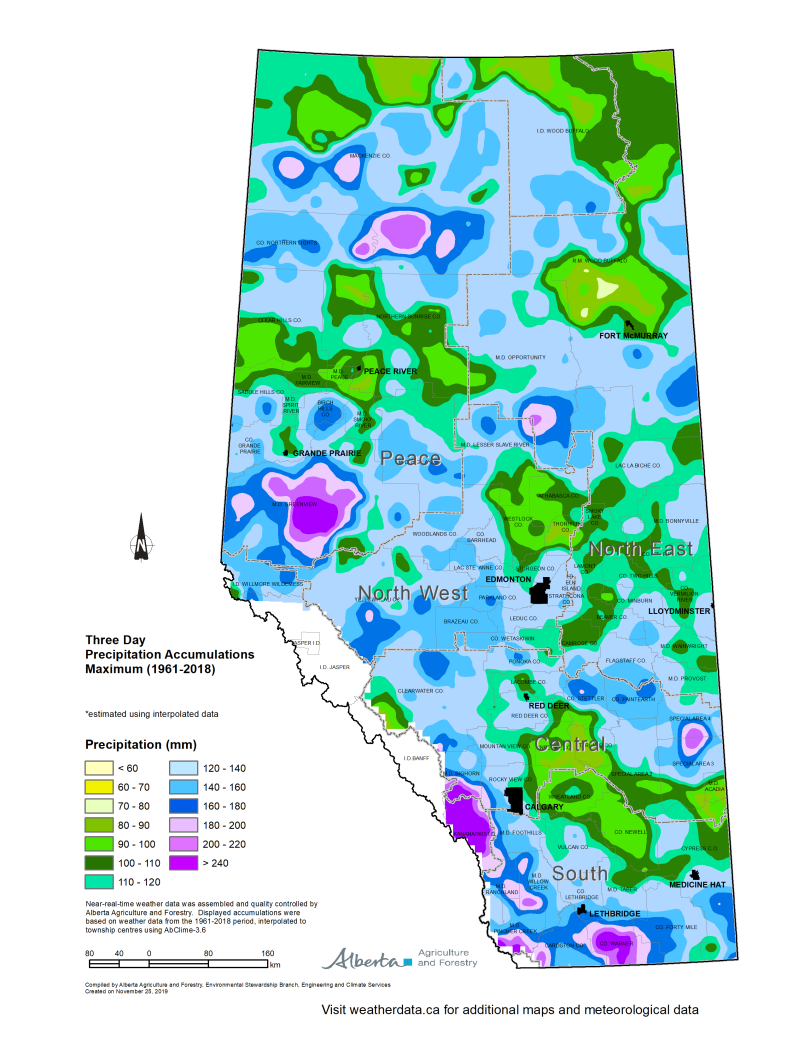
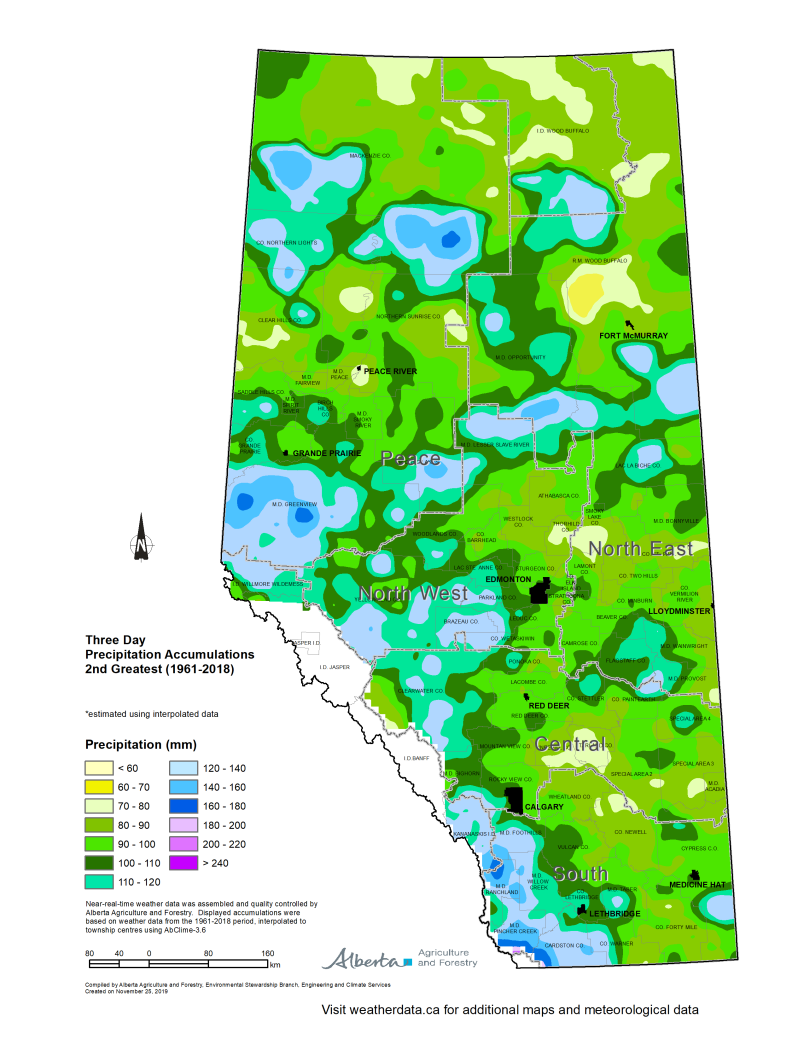
Figure 4. 7-day total precipitation accumulations, highest and second highest
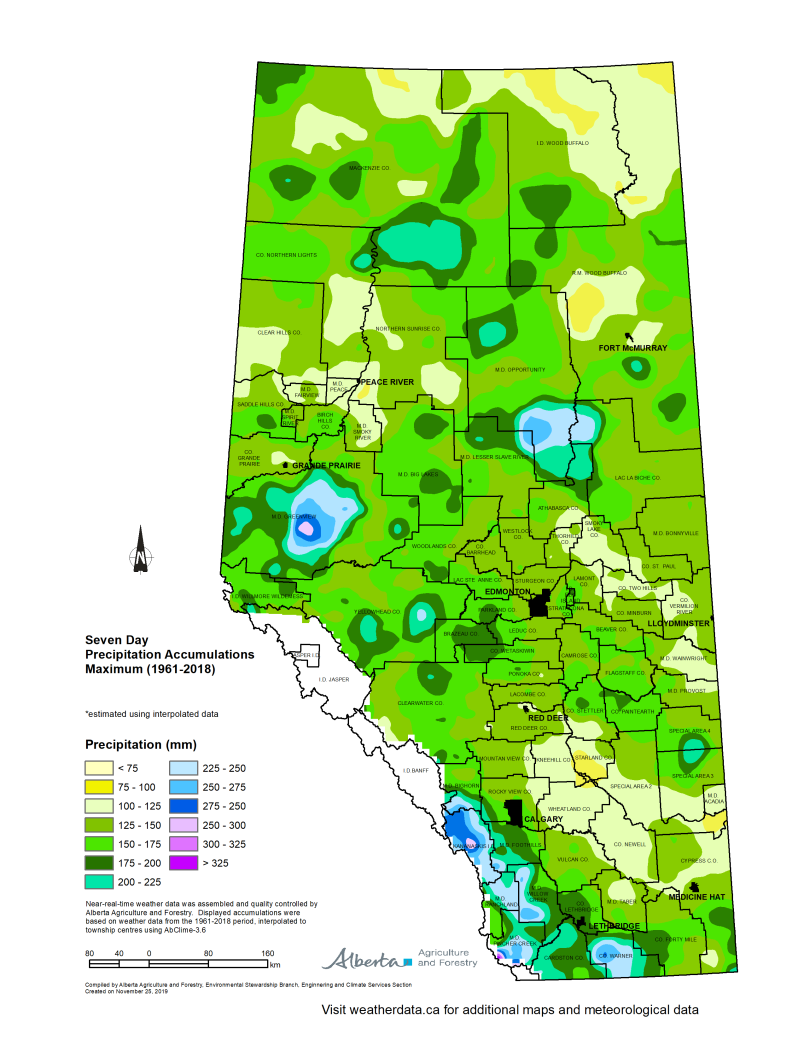
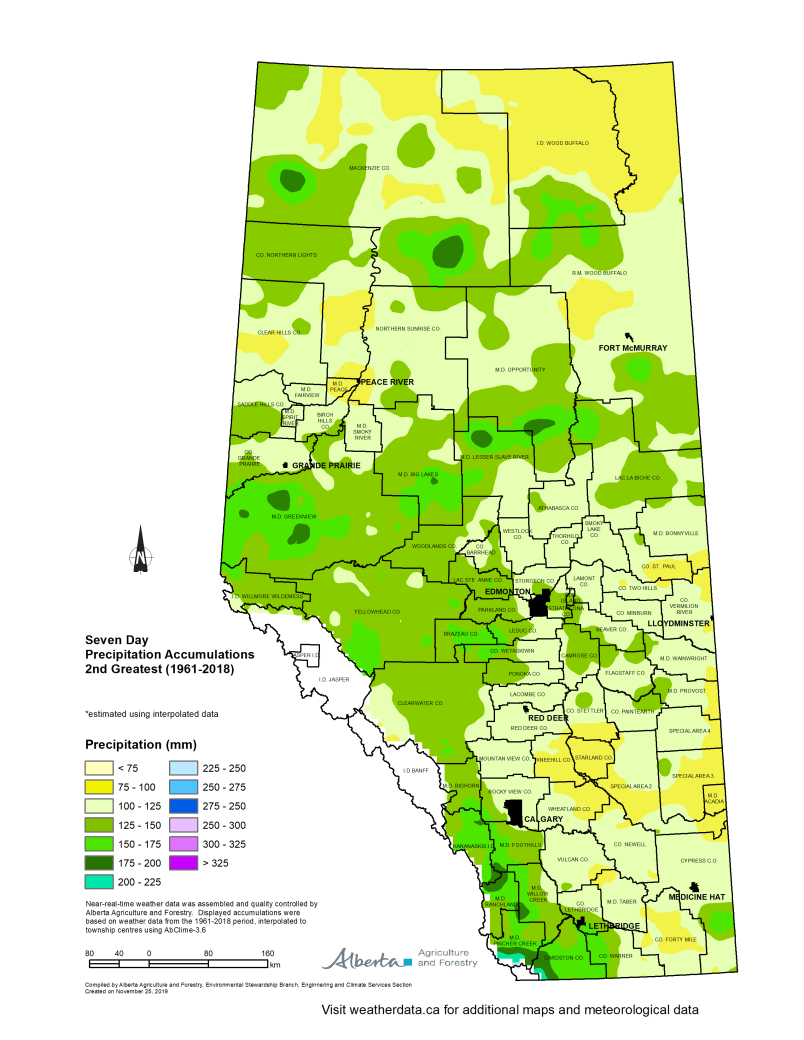
Figure 5. 15-day total precipitation accumulations, highest and second highest
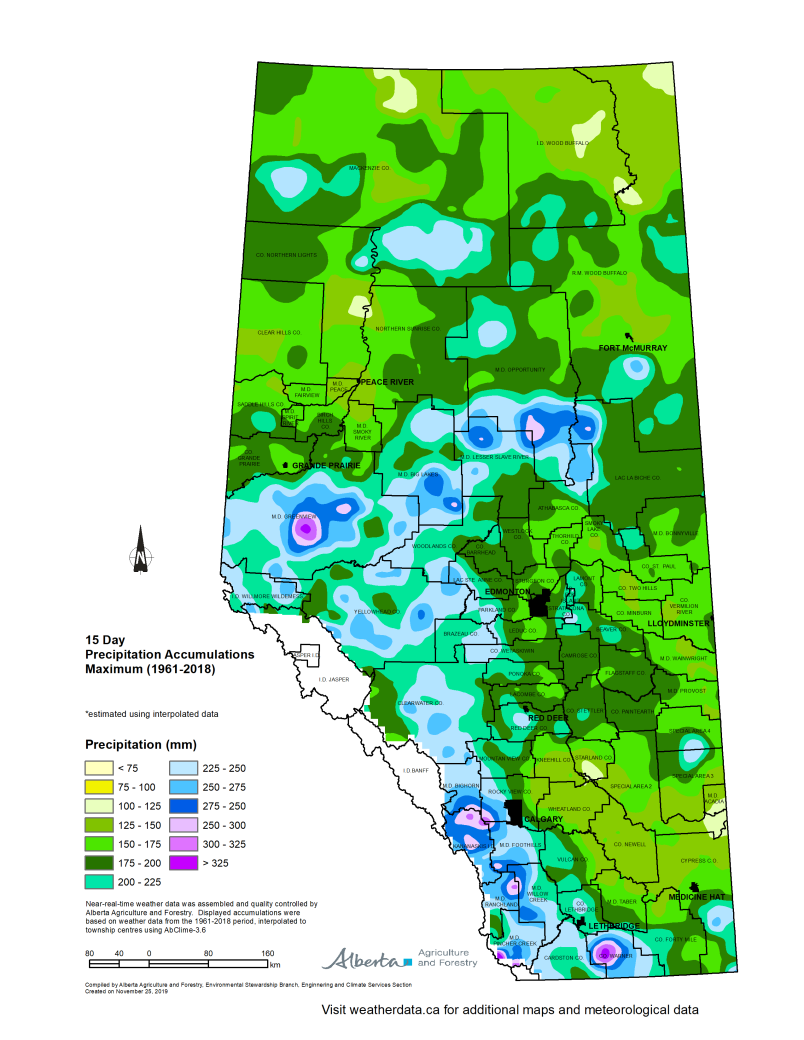
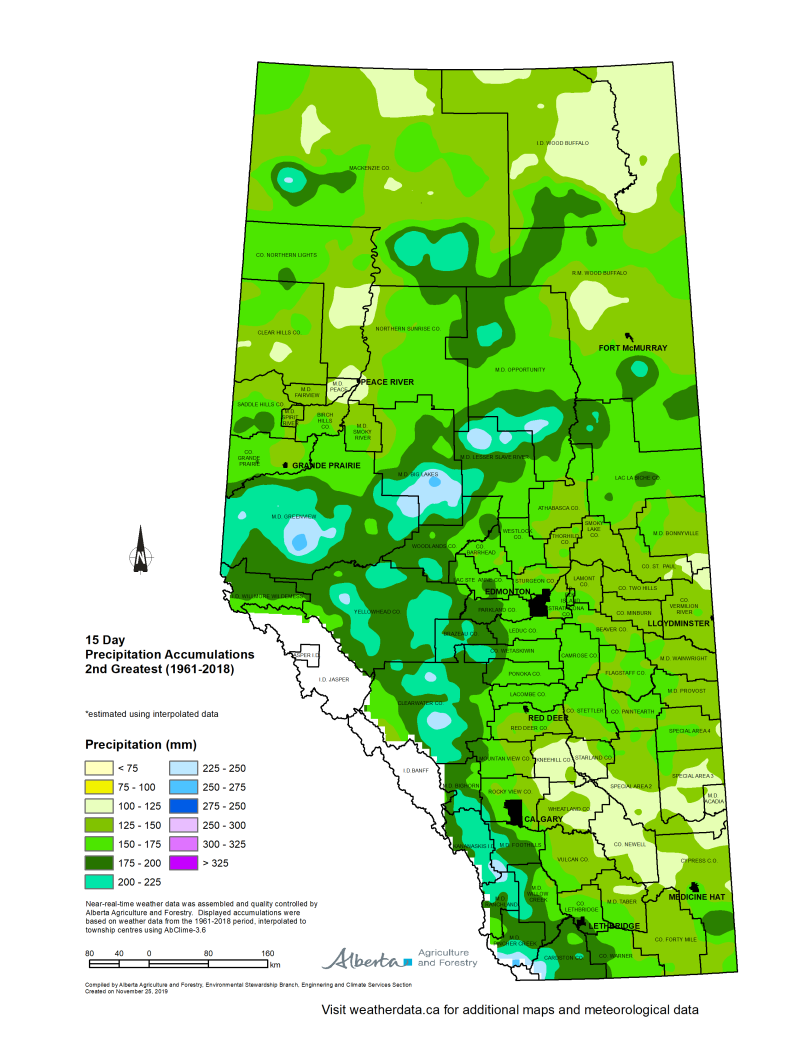
Figure 6. 30-day total precipitation accumulations, highest and second highest
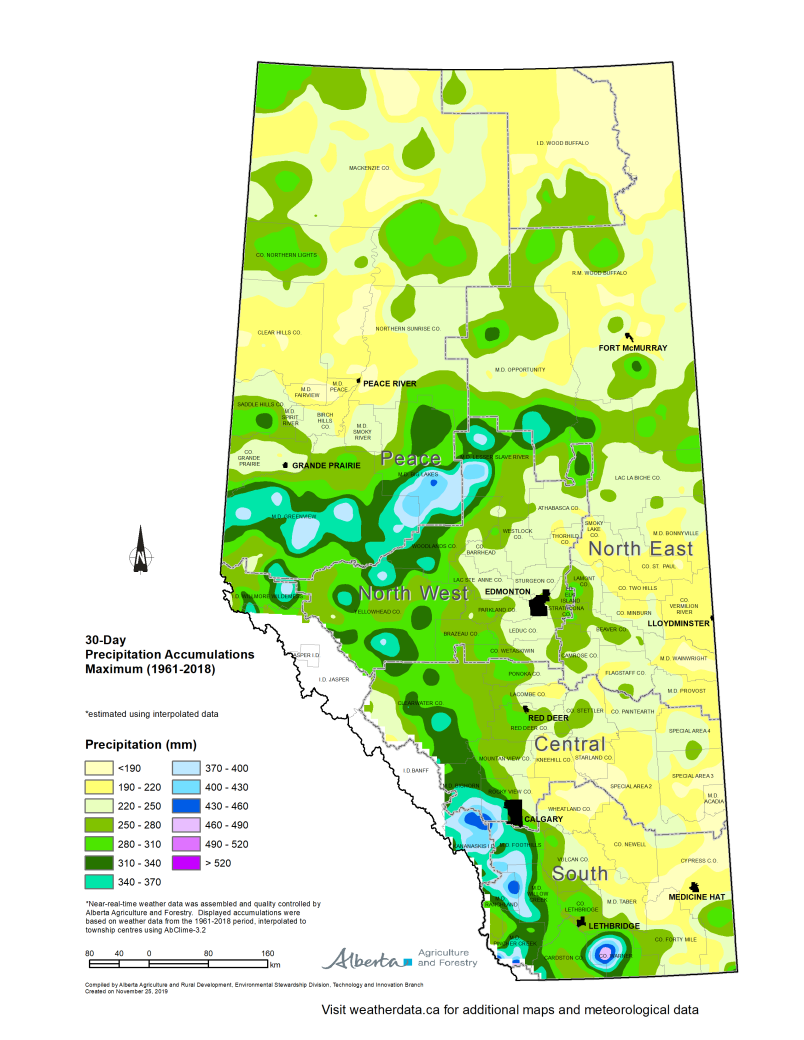
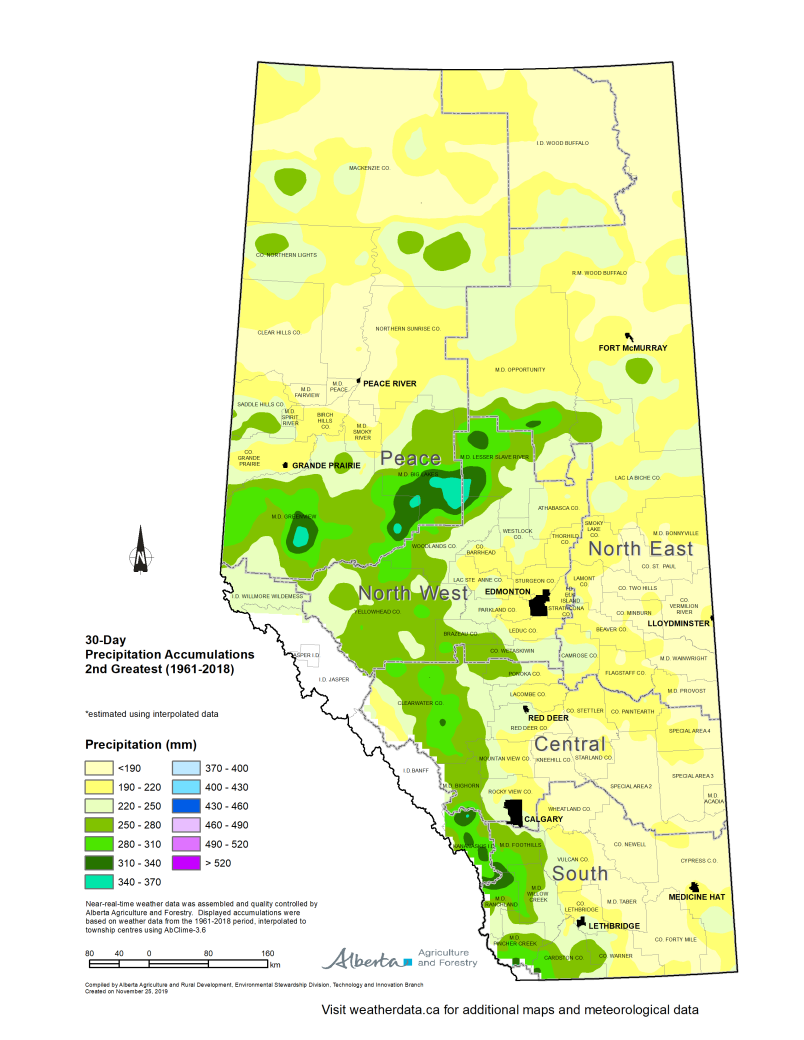
Figure 7. 60-day total precipitation accumulations, highest and second highest
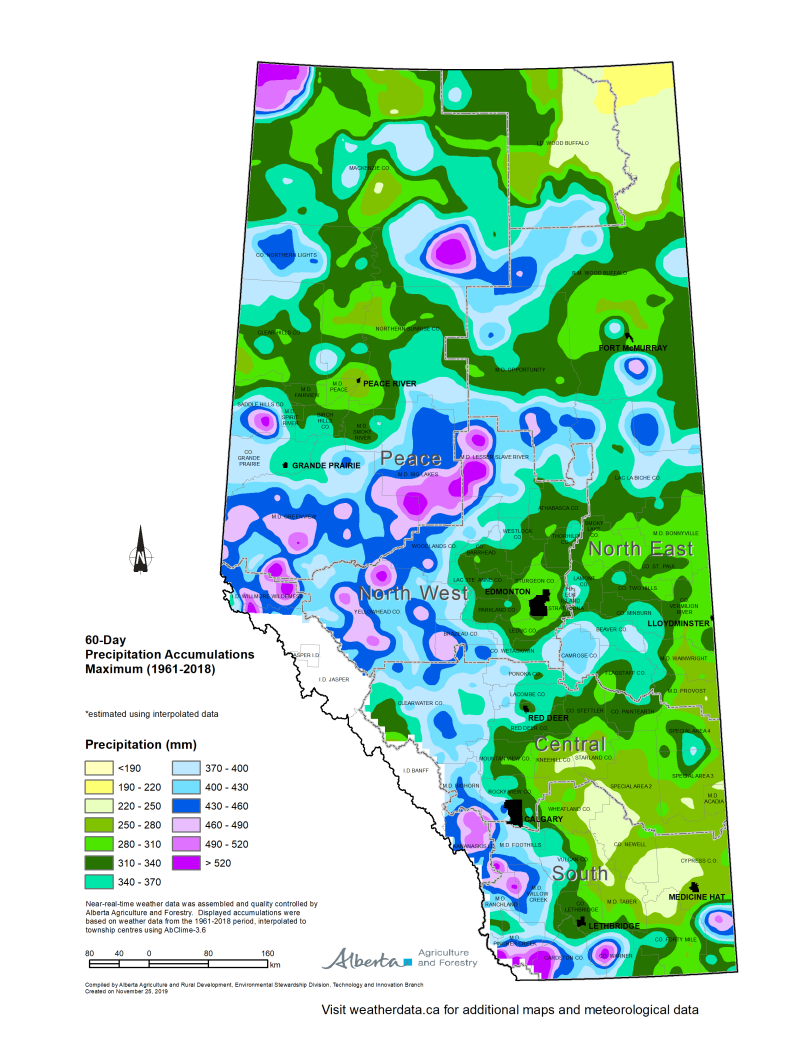
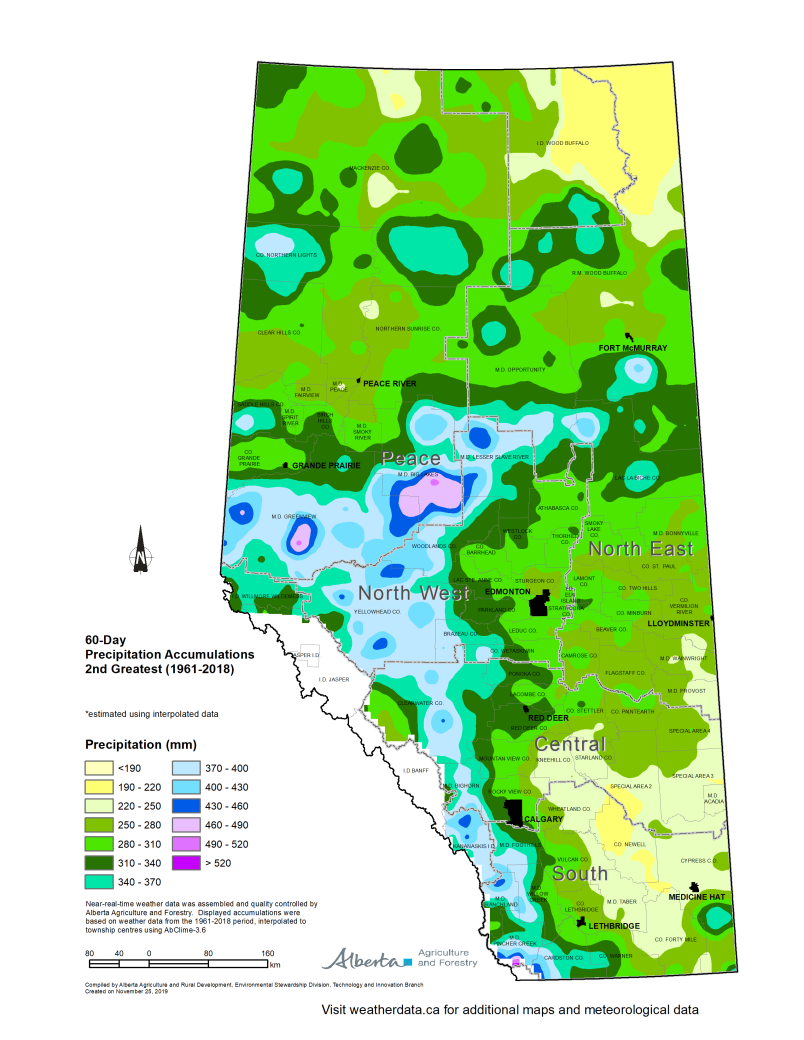
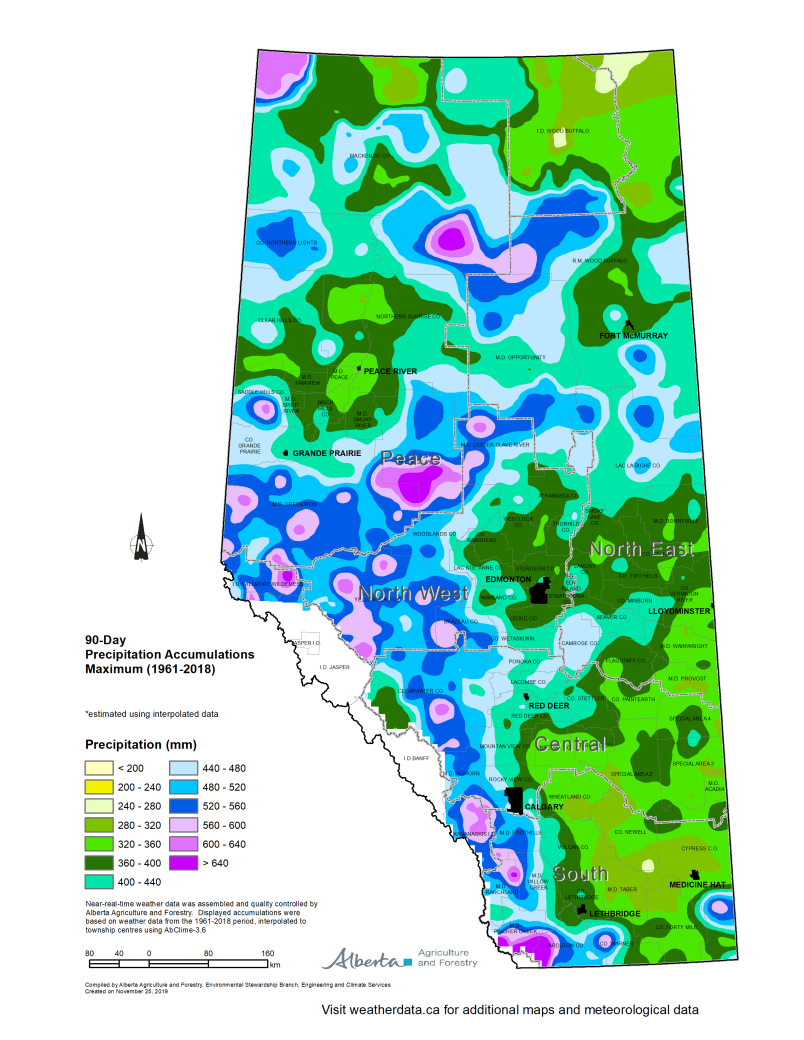
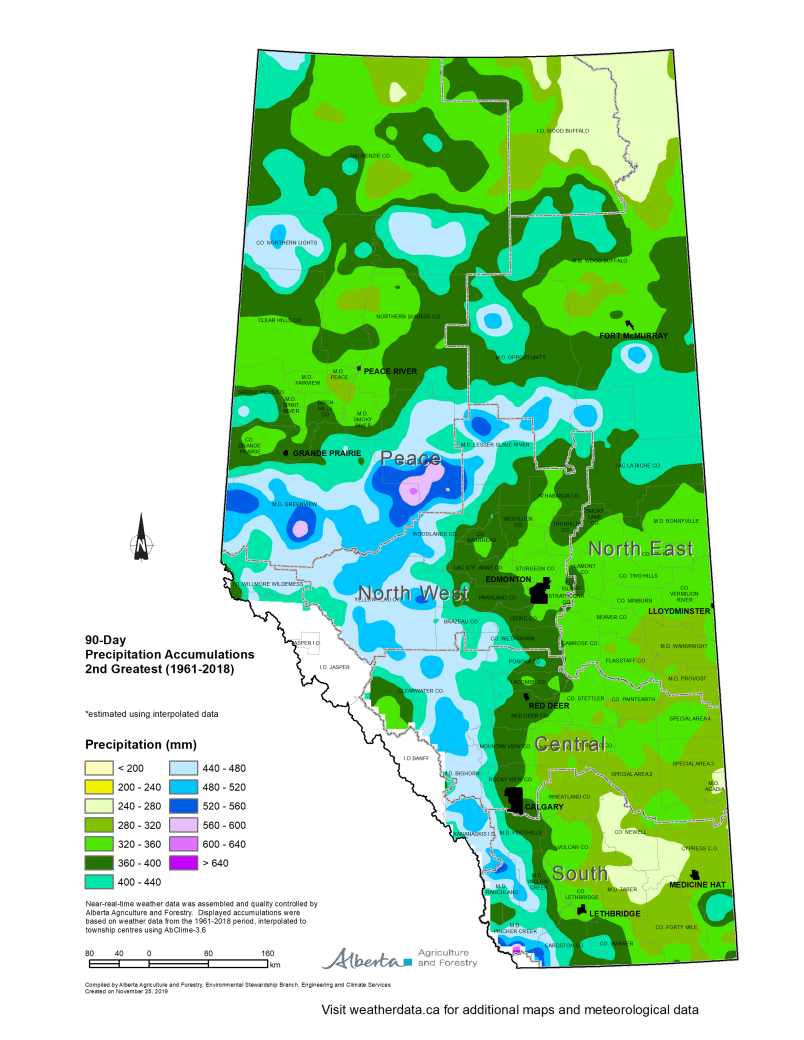
Figure 8. 90-day total precipitation accumulations, highest and second highest
Contact
Connect with the Agro-meteorology unit:
Hours: 8:15 am to 4:30 pm (open Monday to Friday, closed statutory holidays)
Phone: 780-427-3556